Note: input data format must match the example on the right, tab-seperated
1, data from excel, copy and paste data into the input frame
2, data from txt, must tab-seperated, copy and paste data into the input frame
3, use point as decimal separator, not comma. e.g. 3.14, not 3,14 as pi

Required
input data 1:

input data 2:


Optional
Color and width
Outer bar color:
inner bar color:
background color:
bar width:

genome build (now only support hg19)
human hg19
note: Please do not input large data. Plot will be shown in ~15s.

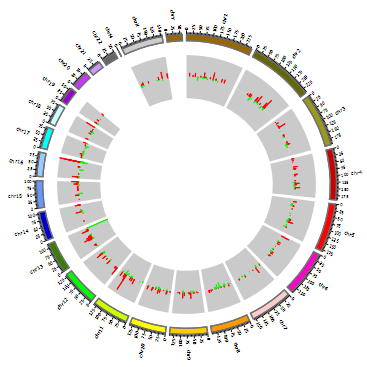
Two tracks circos bar plot

Introduction
circos plot is very popular in high throughput sequencing papers. It depicts peaks, genes, GC content and many more information along chromosomes with different circles.
Input data instructions
Input data contain 4 columns: the first column is chromosome, the second column is start coordinates, the third column is end coordinates, and the last column is values (such as fold change, expression)
Examples from papers
1, show up and down regulated genes.
Input Outer track input data
Inner track input data
Output

1) How to plot?
1, Prepare data
2, Open with excel, and change into the same format as the example
3, Copy and paste data into the input frame
4, Select parameters
5, Submit and download figure files

2) Why NO figure generated?
Script need strigent input format, please read the instructions and examples carefully.

3) How to cite?
2000+ papers in (Google Scholar)
Tang D, Chen M, Huang X, Zhang G, Zeng L, Zhang G, Wu S, Wang Y. SRplot: A free online platform for data visualization and graphing. PLoS One. 2023 Nov 9;18(11):e0294236. doi: 10.1371/journal.pone.0294236. PMID: 37943830.

4) FAQs