GO term BP, CC, MF three in one bar plot
Introduction
Put GO terms (BP, CC, MF) into one bar plot, and surround terms with frame lines. You may use our
GO/Pathway Enrichment Analysis or
metascape to get GO enrichment results, and then plot this figure.
Input data instructions
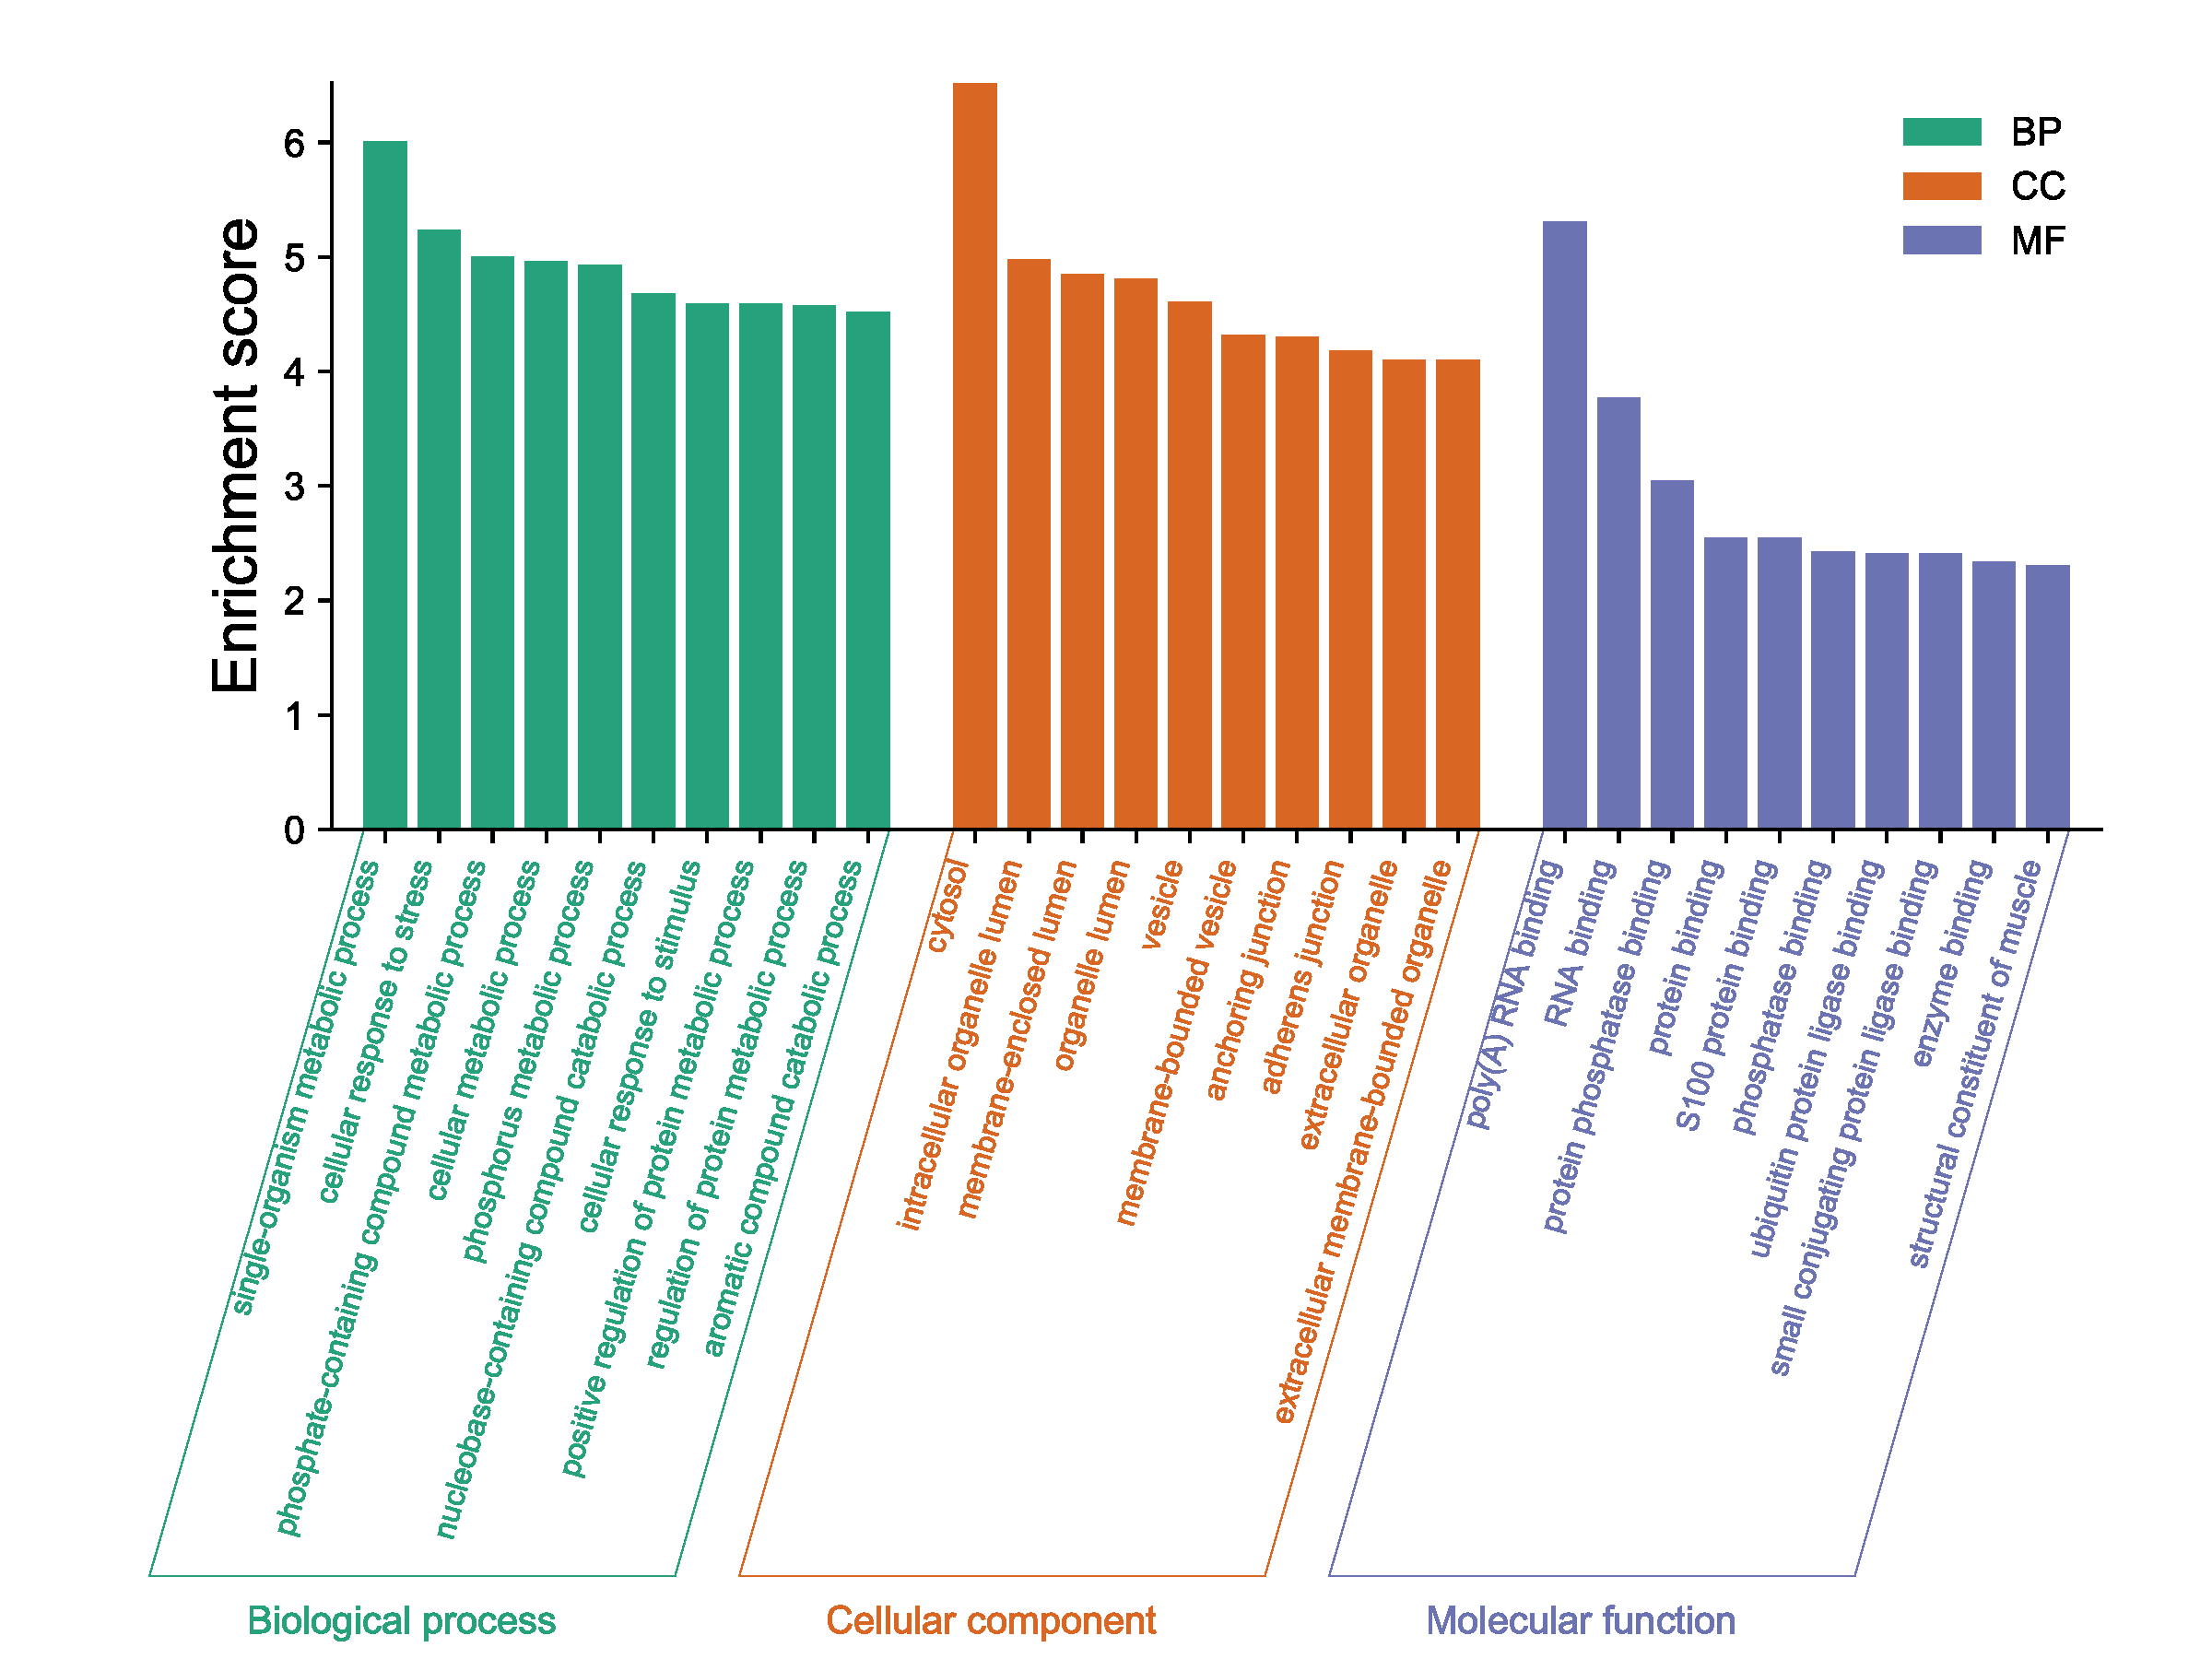
Input data contain three columns: the first column is GO term, the second column is category (MUST be one of Biological process, Cellular component, Molecular function, and order is: Biological process on the top, Cellular component in the middle, and Molecular function at the bottom. The third column is positive values (enrichment, -log10(p-value), -log10(FDR), ...).
Paper example
The anti-inflammatory mechanism of the medicinal fungus puffball analysis based on network pharmacology
Writing tips
GO function analysis histogram. BP is marked by dark cyan, CC is marked by sienna and MF is marked by steel blue.
1) How to plot?
1, Put data in excel according to the example format.
2, Copy and paste into input frame.
3, Input pre-checking button to check input
4, After checking pass, select parameters, submit and download
2) How to cite?
9000+ papers in (Google Scholar)
Tang D, Chen M, Huang X, Zhang G, Zeng L, Zhang G, Wu S, Wang Y. SRplot: A free online platform for data visualization and graphing. PLoS One. 2023 Nov 9;18(11):e0294236. doi: 10.1371/journal.pone.0294236. PMID: 37943830.
3) FAQs