Read before use
1, check data with precheck (windows version) tools
2, data from excel, copy and paste data into the input frame
3, data from txt, must tab-seperated, copy and paste data into the input frame
4, specieal and non-English characters such as #, <, >, %, (, ), α are not friendly
5, use point as decimal separator, not comma. e.g. 3.14, not 3,14 as pi

Required
input gene list (symbol, logfc), no more than 4000 lines (no header line)
if no logfc, 1 (up) or -1 (down) was added automatically for pathway coloring


Species


note: heavily cpu consumtion, freely only on (Beijing time 22:10-8:00)
This figure will consume 1 Points

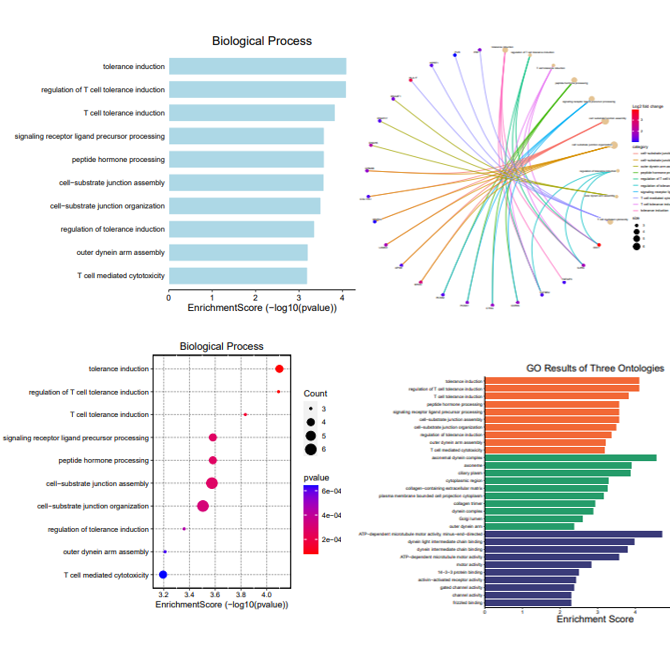
GO, pathway Enrichment Analysis

Introduction
This module combined clusterProfiler and pathview. Find source codes in official website.
Input data instructions
Input gene list (symbol, logfc), no more than 3000 lines. If no logfc, use 1 or -1 instead.
References
Guangchuang Yu, Li-Gen Wang, Yanyan Han, Qing-Yu He. clusterProfiler: an R package for comparing biological themes among gene clusters. OMICS: A Journal of Integrative Biology. 2012, 16(5):284-287.
Luo W, Brouwer C. Pathview: an R/Biocondutor package for pathway-based data integration and visualization. Bioinformatics, 2013, 29(14):1830-1831, doi: 10.1093/bioinformatics/btt285

Input Example
Output Example results

1) How to plot?
1, Prepare data
2, Open with excel, and change into the same format as the example
3, Copy and paste data into the input frame
4, Select parameters
5, Submit and download figure files

2) Why NO figure generated?
Script need strigent input format, please read the instructions and examples carefully.

3) How to cite?
2000+ papers in (Google Scholar)
Tang D, Chen M, Huang X, Zhang G, Zeng L, Zhang G, Wu S, Wang Y. SRplot: A free online platform for data visualization and graphing. PLoS One. 2023 Nov 9;18(11):e0294236. doi: 10.1371/journal.pone.0294236. PMID: 37943830.

4) FAQs