GO chord图(GO弦图)
简介
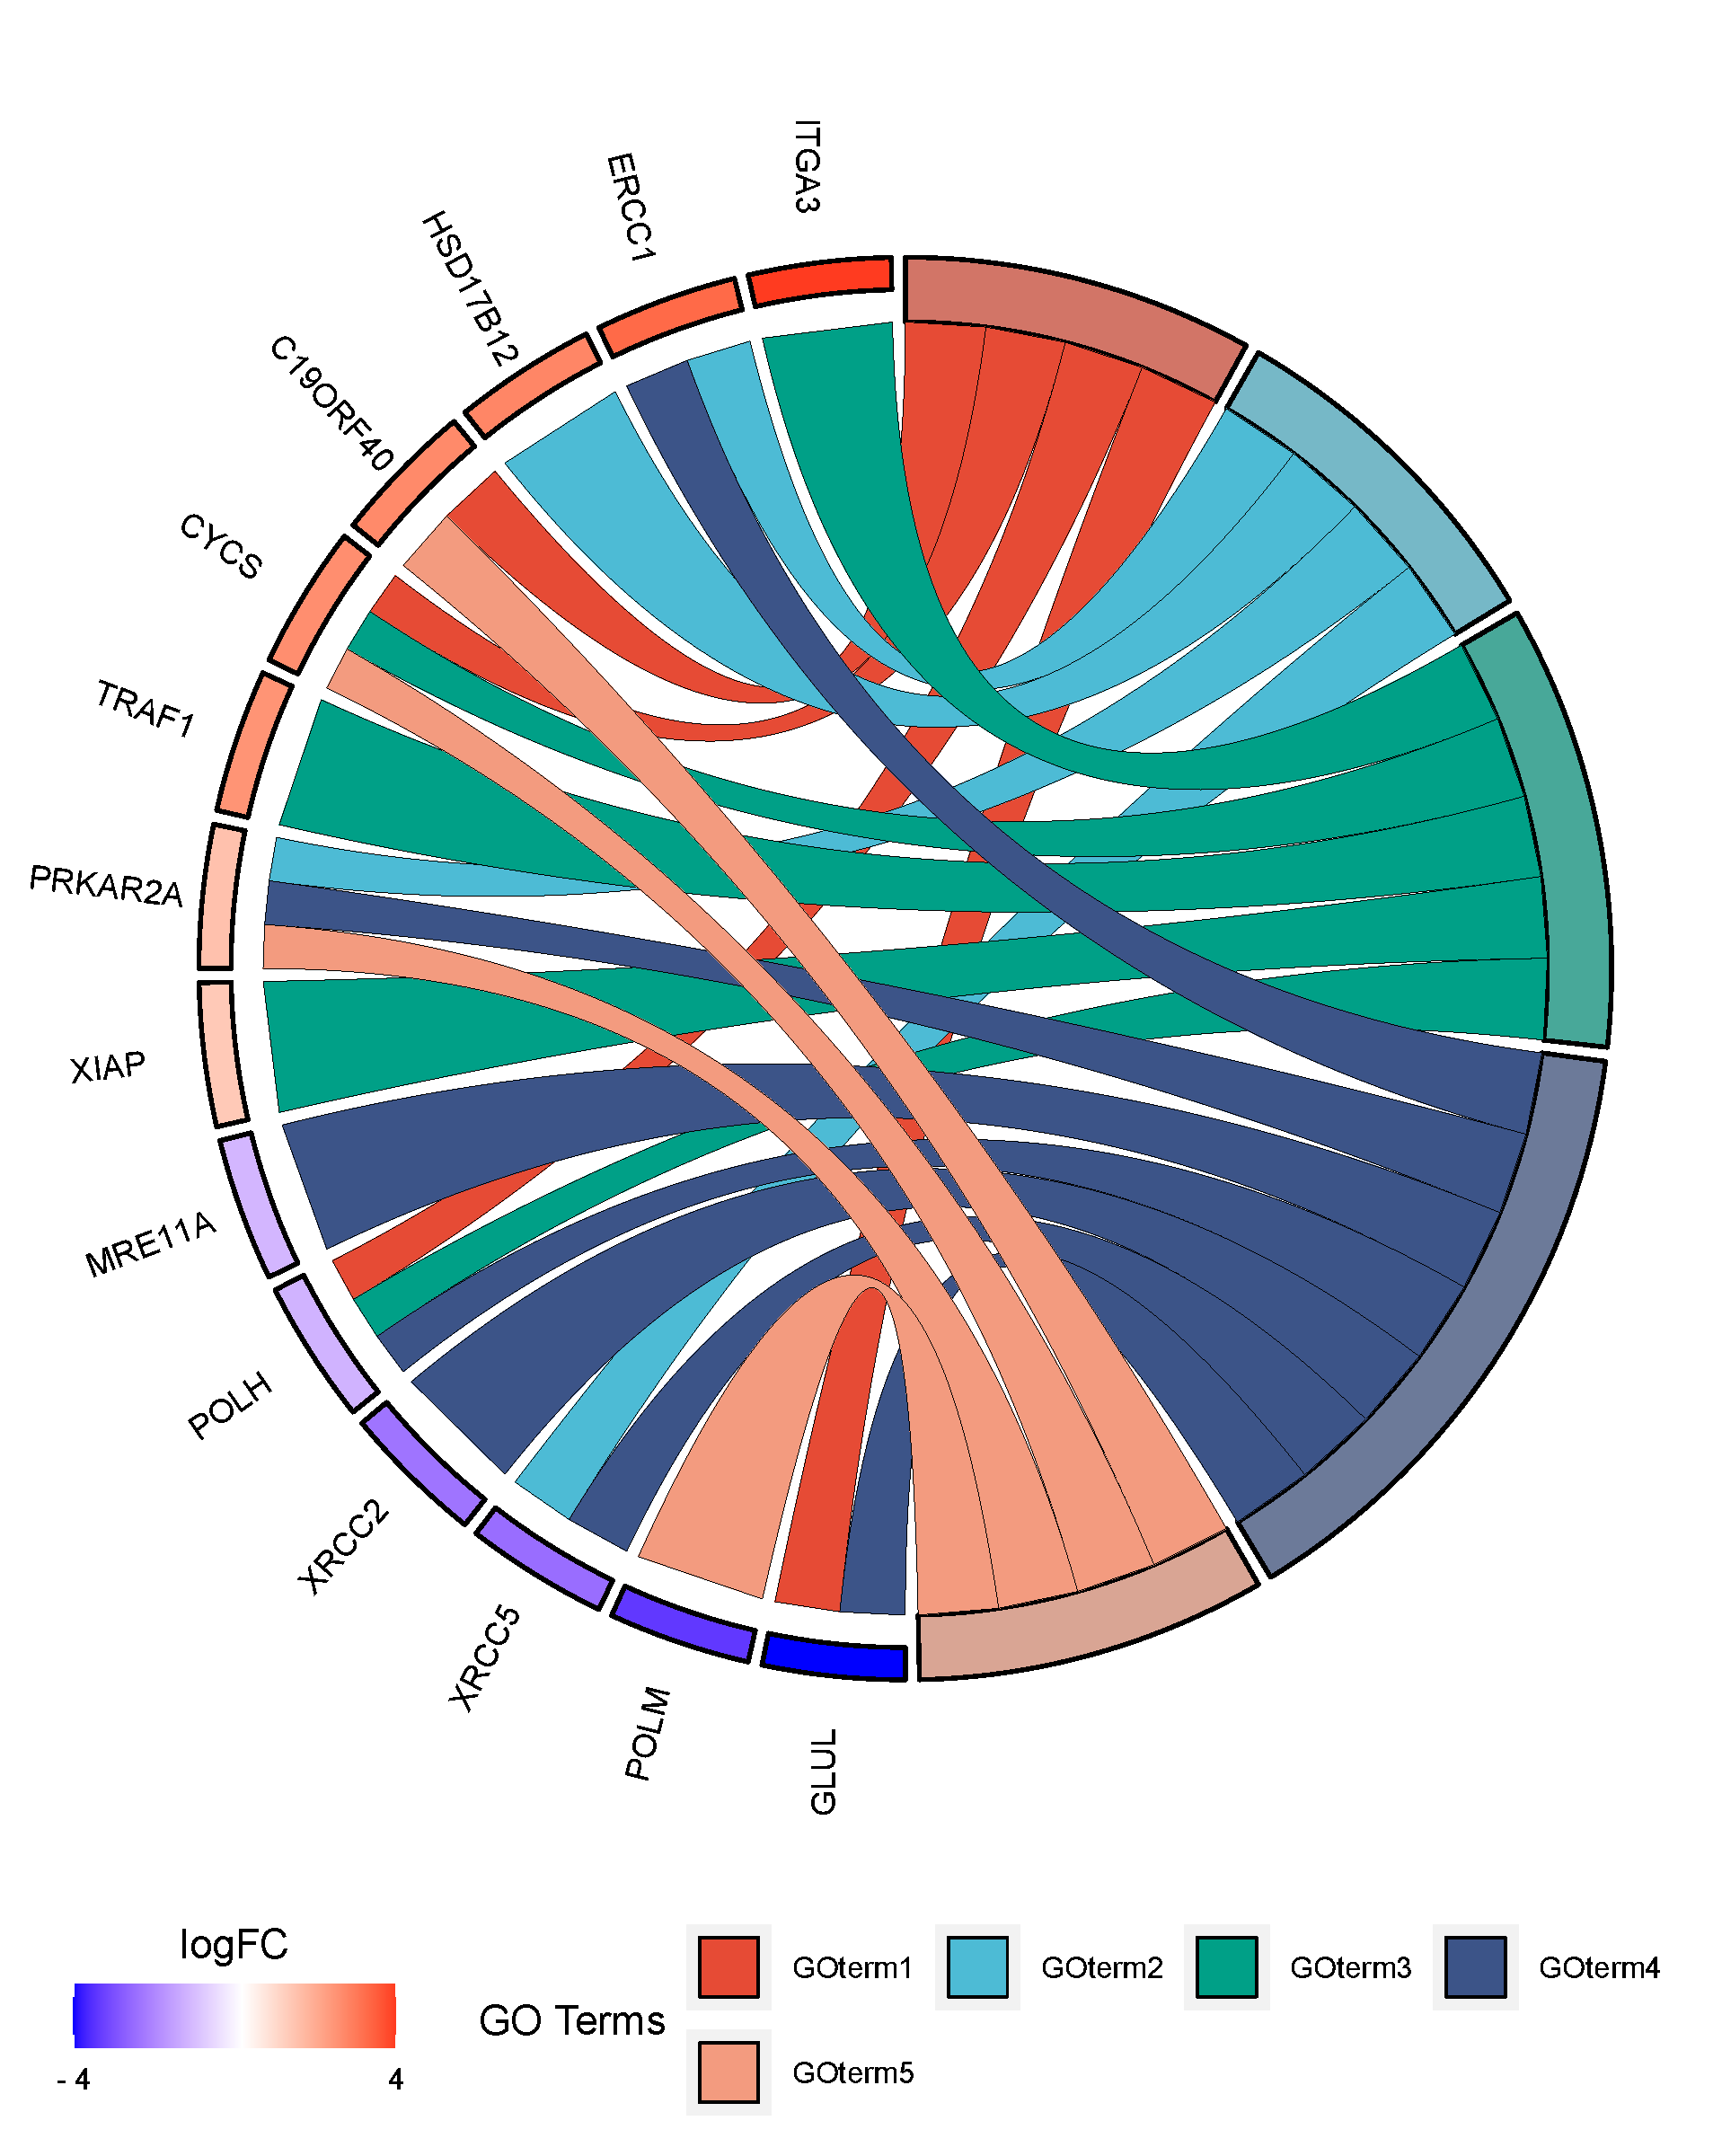
使用弦图展示富集结果,左边是基因,右边是GO term,中间的连线表示从属关系。可以使用
GO analysis或者
metascape提交基因,计算富集,得到结果后进行绘图。参考
格式转换页面。调用GOplot R包
输入数据说明
数据包括3部分,第一列是基因,最后一列是logFC(名字不变,仅替换数据即可),即基因的变化倍数,用于排序及基因块颜色(若没有logFC,程序会自动添加,基因色块用灰色)
其余列是GO term,其中1表示该基因在这个GO term中,0表示不在(必需是0或者1,不能是其他数值)。默认不过滤,即有几个显示几个,20-30个基因,6-8个term效果比较好。最多绘制30个。
注意:
1. 也可以用于具有类似包含关系的其他数据中,例如KEGG Pathway。
2. 若term名太长,可以用
inkscape编辑svg输出图片。
3. 若不是正圆,修改图片长度或者高度参数。
4. 若logfc没显示,可以用编辑器编辑图片以显示。
论文例子
An intersectional analysis of LncRNAs and mRNAs reveals the potential therapeutic targets of Bi Zhong Xiao Decoction in collagen-induced arthritis rats
如何引用?
建议直接写网址。助力发表9800+篇
(google学术),8500+篇
(知网)论文
正式引用:Tang D, Chen M, Huang X, Zhang G, Zeng L, Zhang G, Wu S, Wang Y.
SRplot: A free online platform for data visualization and graphing. PLoS One. 2023 Nov 9;18(11):e0294236. doi: 10.1371/journal.pone.0294236. PMID: 37943830.
方法章节:Heatmap was plotted by https://www.bioinformatics.com.cn (last accessed on 10 Dec 2024), an online platform for data analysis and visualization.
致谢章节:We thank Mingjie Chen (Shanghai NewCore Biotechnology Co., Ltd.) for providing data analysis and visualization support.