子弹图(bullet chart)
简介
用以描述是否达到预期目标等
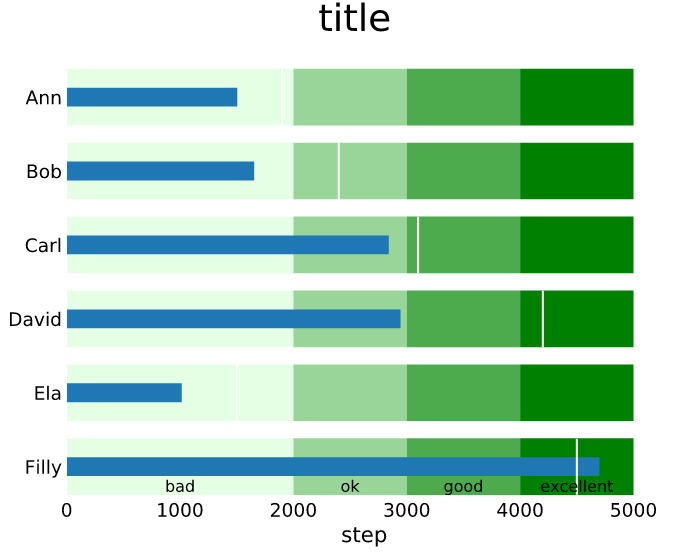
数据说明5个人的预期目标。分成4档:bad,norm,good,excellent。
Ann的目标是1900,而她实际步数为1505,属于bad档。
Carl的目标是3100,而他实际步数为2841,属于norm档。
论文例子
| 输入1 |
person	step	target
Ann	1505	1900
Bob	1654	2400
Carl	2841	3100
David	2945	4200
Ela	1015	1500
Filly 4700 4500 |
| 输入2 |
bad	ok	good	excellent
2000 3000 4000 5000 |
| 输出 |
|
如何引用?
建议直接写网址。助力发表9600+篇
(google学术),8500+篇
(知网)论文
正式引用:Tang D, Chen M, Huang X, Zhang G, Zeng L, Zhang G, Wu S, Wang Y.
SRplot: A free online platform for data visualization and graphing. PLoS One. 2023 Nov 9;18(11):e0294236. doi: 10.1371/journal.pone.0294236. PMID: 37943830.
方法章节:Heatmap was plotted by https://www.bioinformatics.com.cn (last accessed on 10 Dec 2024), an online platform for data analysis and visualization.
致谢章节:We thank Mingjie Chen (Shanghai NewCore Biotechnology Co., Ltd.) for providing data analysis and visualization support.
