输入 |
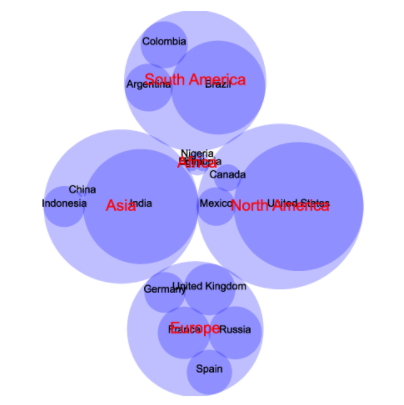
continent country COVID-19 North America United States 37345854 North America Mexico 3101266 North America Canada 1455973 South America Brazil 20378570 South America Colombia 4870922 South America Argentina 5088205 Europe Germany 3845034 Europe France 6471035 Europe Russia 6621601 Europe Spain 4719266 Europe United Kingdom 6295613 Africa Nigeria 182503 Africa Ethiopia 289274 Africa Egypt 285358 Asia China 94430 Asia India 32249900 Asia Indonesia 3871738 |
输出 |
1)如何作图?
1,准备作图数据;2,用excel打开数据,调整为示例格式;3,将调整后的数据粘贴到输入框;4,选择参数;5,提交出图
2)为什么不出图?
对输入数据格式有严格要求。请观看输入框上面的视频介绍,并仔细阅读右侧说明,示例数据。
3)如何引用?
3000+篇google学术,2400+篇知网学术引用
推荐直接写网址
Cite: Tang D, Chen M, Huang X, Zhang G, Zeng L, Zhang G, Wu S, Wang Y. SRplot: A free online platform for data visualization and graphing. PLoS One. 2023 Nov 9;18(11):e0294236. doi: 10.1371/journal.pone.0294236. PMID: 37943830.
Method: Heatmap was plotted by https://www.bioinformatics.com.cn (last accessed on 20 Feb 2024), an online platform for data analysis and visualization.
Acknowledgement: We thank Shanghai NewCore Biotechnology Co., Ltd. (https://www.bioinformatics.com.cn, last accessed on 20 Feb 2024) for providing data analysis and visualization support.
4)交流群/公众号