上下柱状图(bar plot)
简介
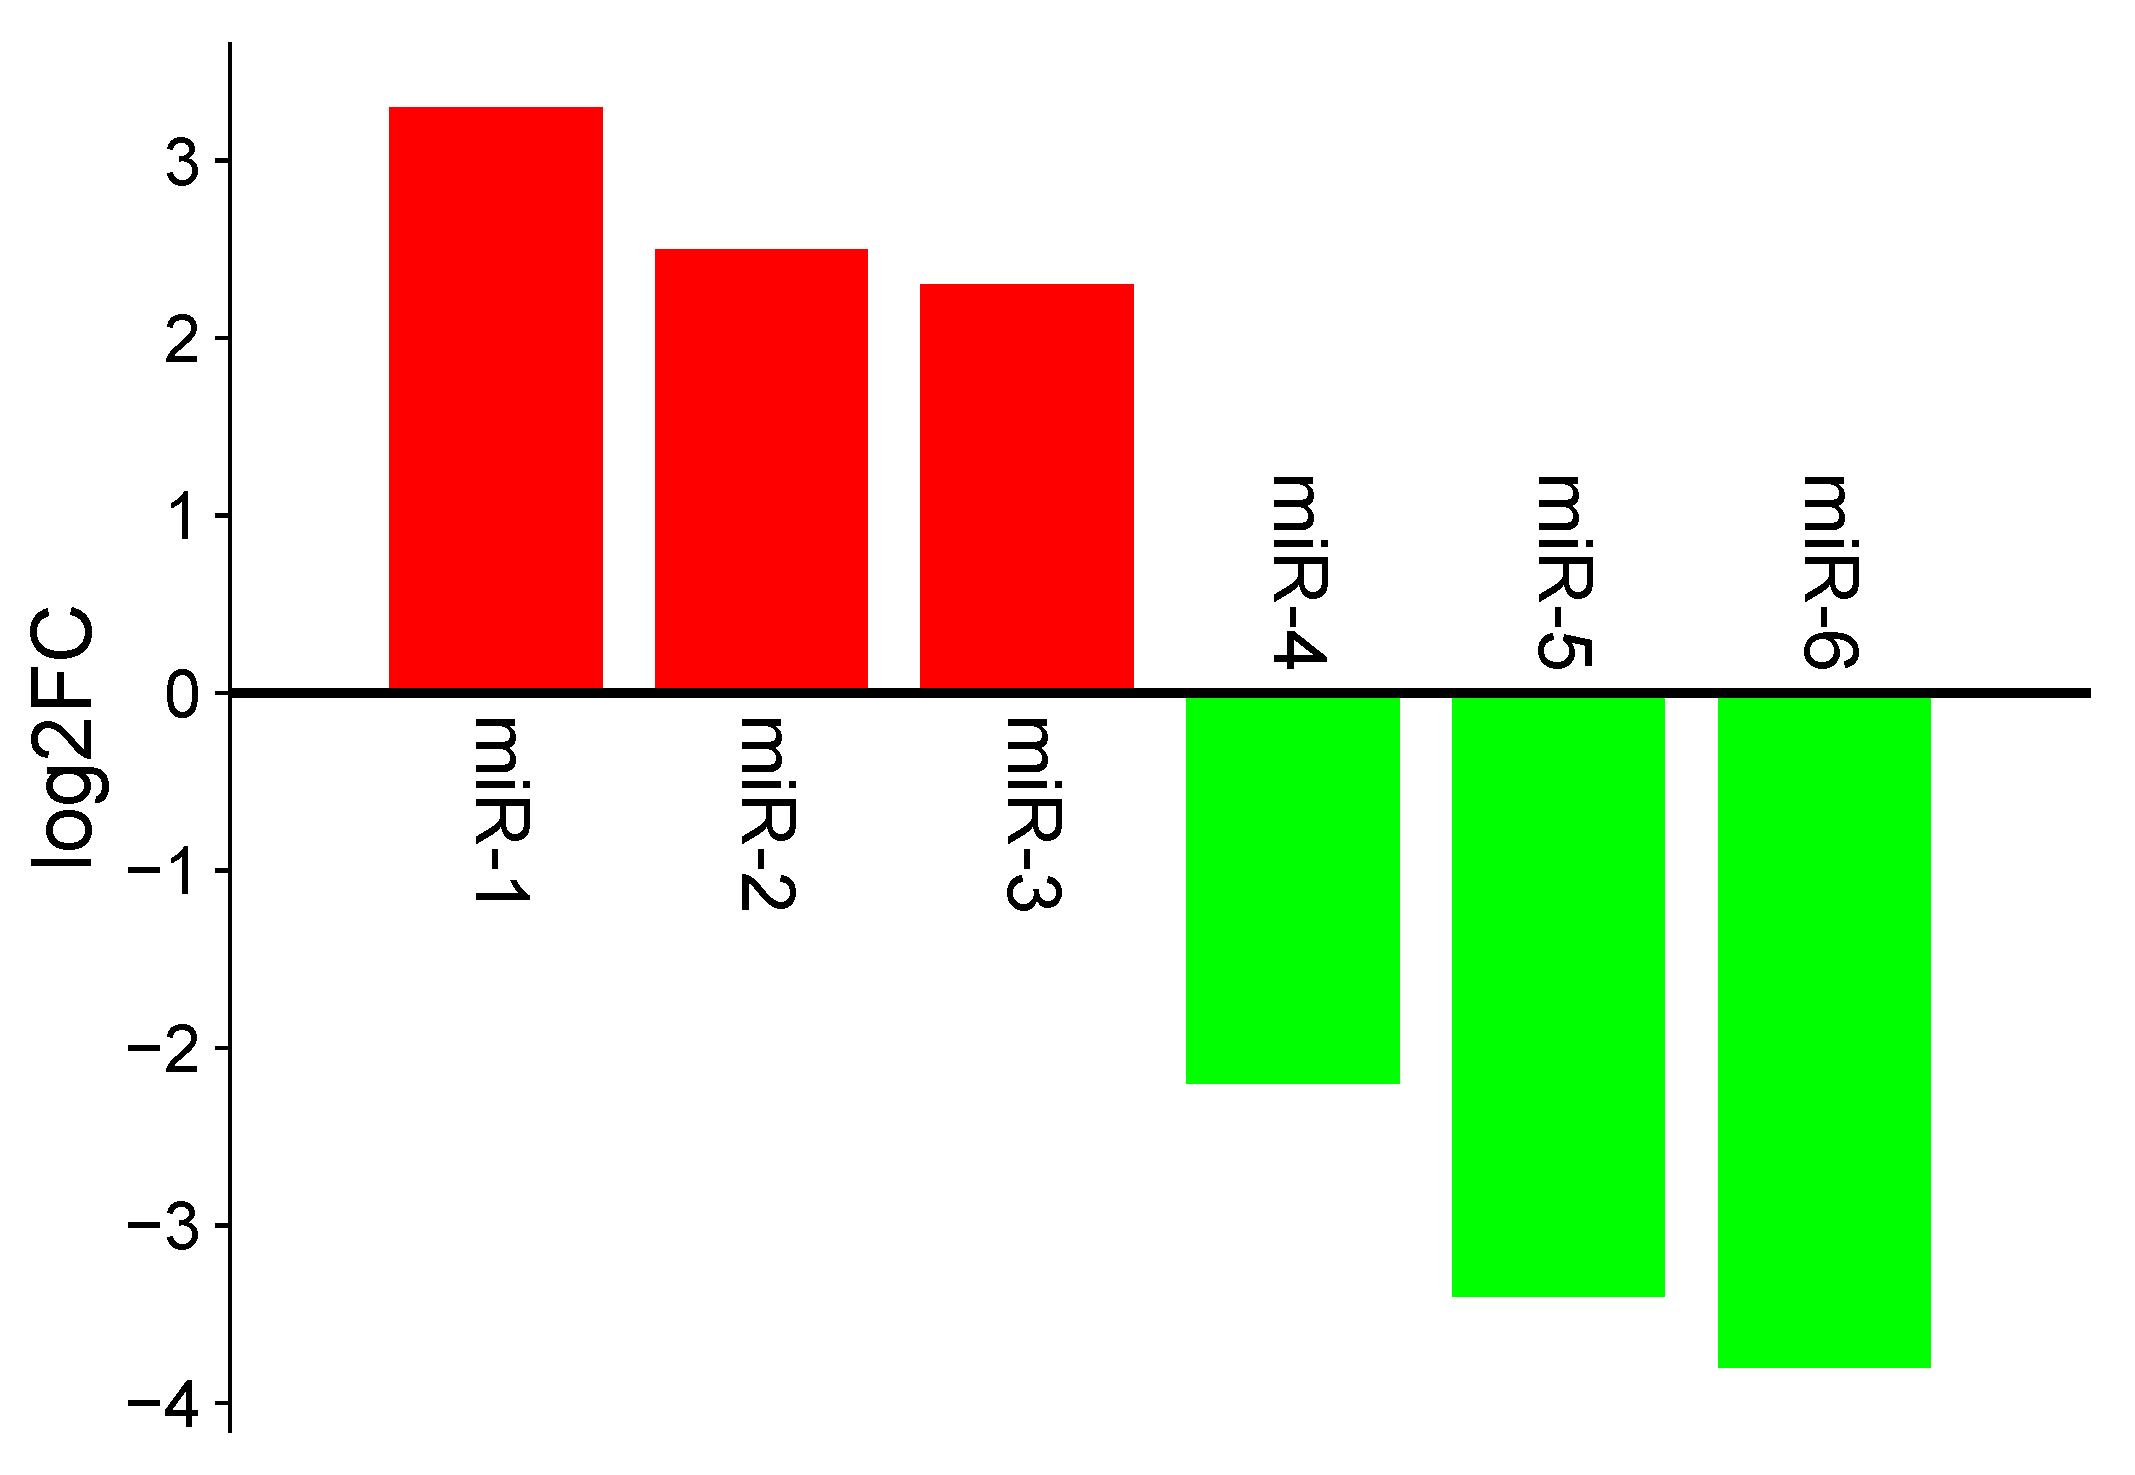
采用柱形图绘制差异miRNA及倍数变化(适用于miRNA,lncRNA,circRNA等)。X轴表示miRNA,Y轴表示log2的倍数变化。红色表示上调,在X轴上方;绿色表示下调,在X轴下方。
注意:数据需要先排序才好看。
输入数据说明
输入数据为两行:第一行表示不同miRNAs;第二行表示log2的倍数变化。
论文例子
Construction of circ_0071922-miR-15a-5p-mRNA network in intervertebral disc degeneration by RNA-sequencing. Fig 1E
如何引用?
建议直接写网址。助力10000+篇
(google学术),9000+篇
(知网)论文
正式引用:Tang D, Chen M, Huang X, Zhang G, Zeng L, Zhang G, Wu S, Wang Y.
SRplot: A free online platform for data visualization and graphing. PLoS One. 2023 Nov 9;18(11):e0294236. doi: 10.1371/journal.pone.0294236. PMID: 37943830.
方法章节:Heatmap was plotted by https://www.bioinformatics.com.cn (last accessed on May 4, 2026), an online platform for data analysis and visualization.
致谢章节:We thank Mingjie Chen (Shanghai NewCore Biotechnology Co., Ltd.) for providing data analysis and visualization support.