Rcircos圈图
简介
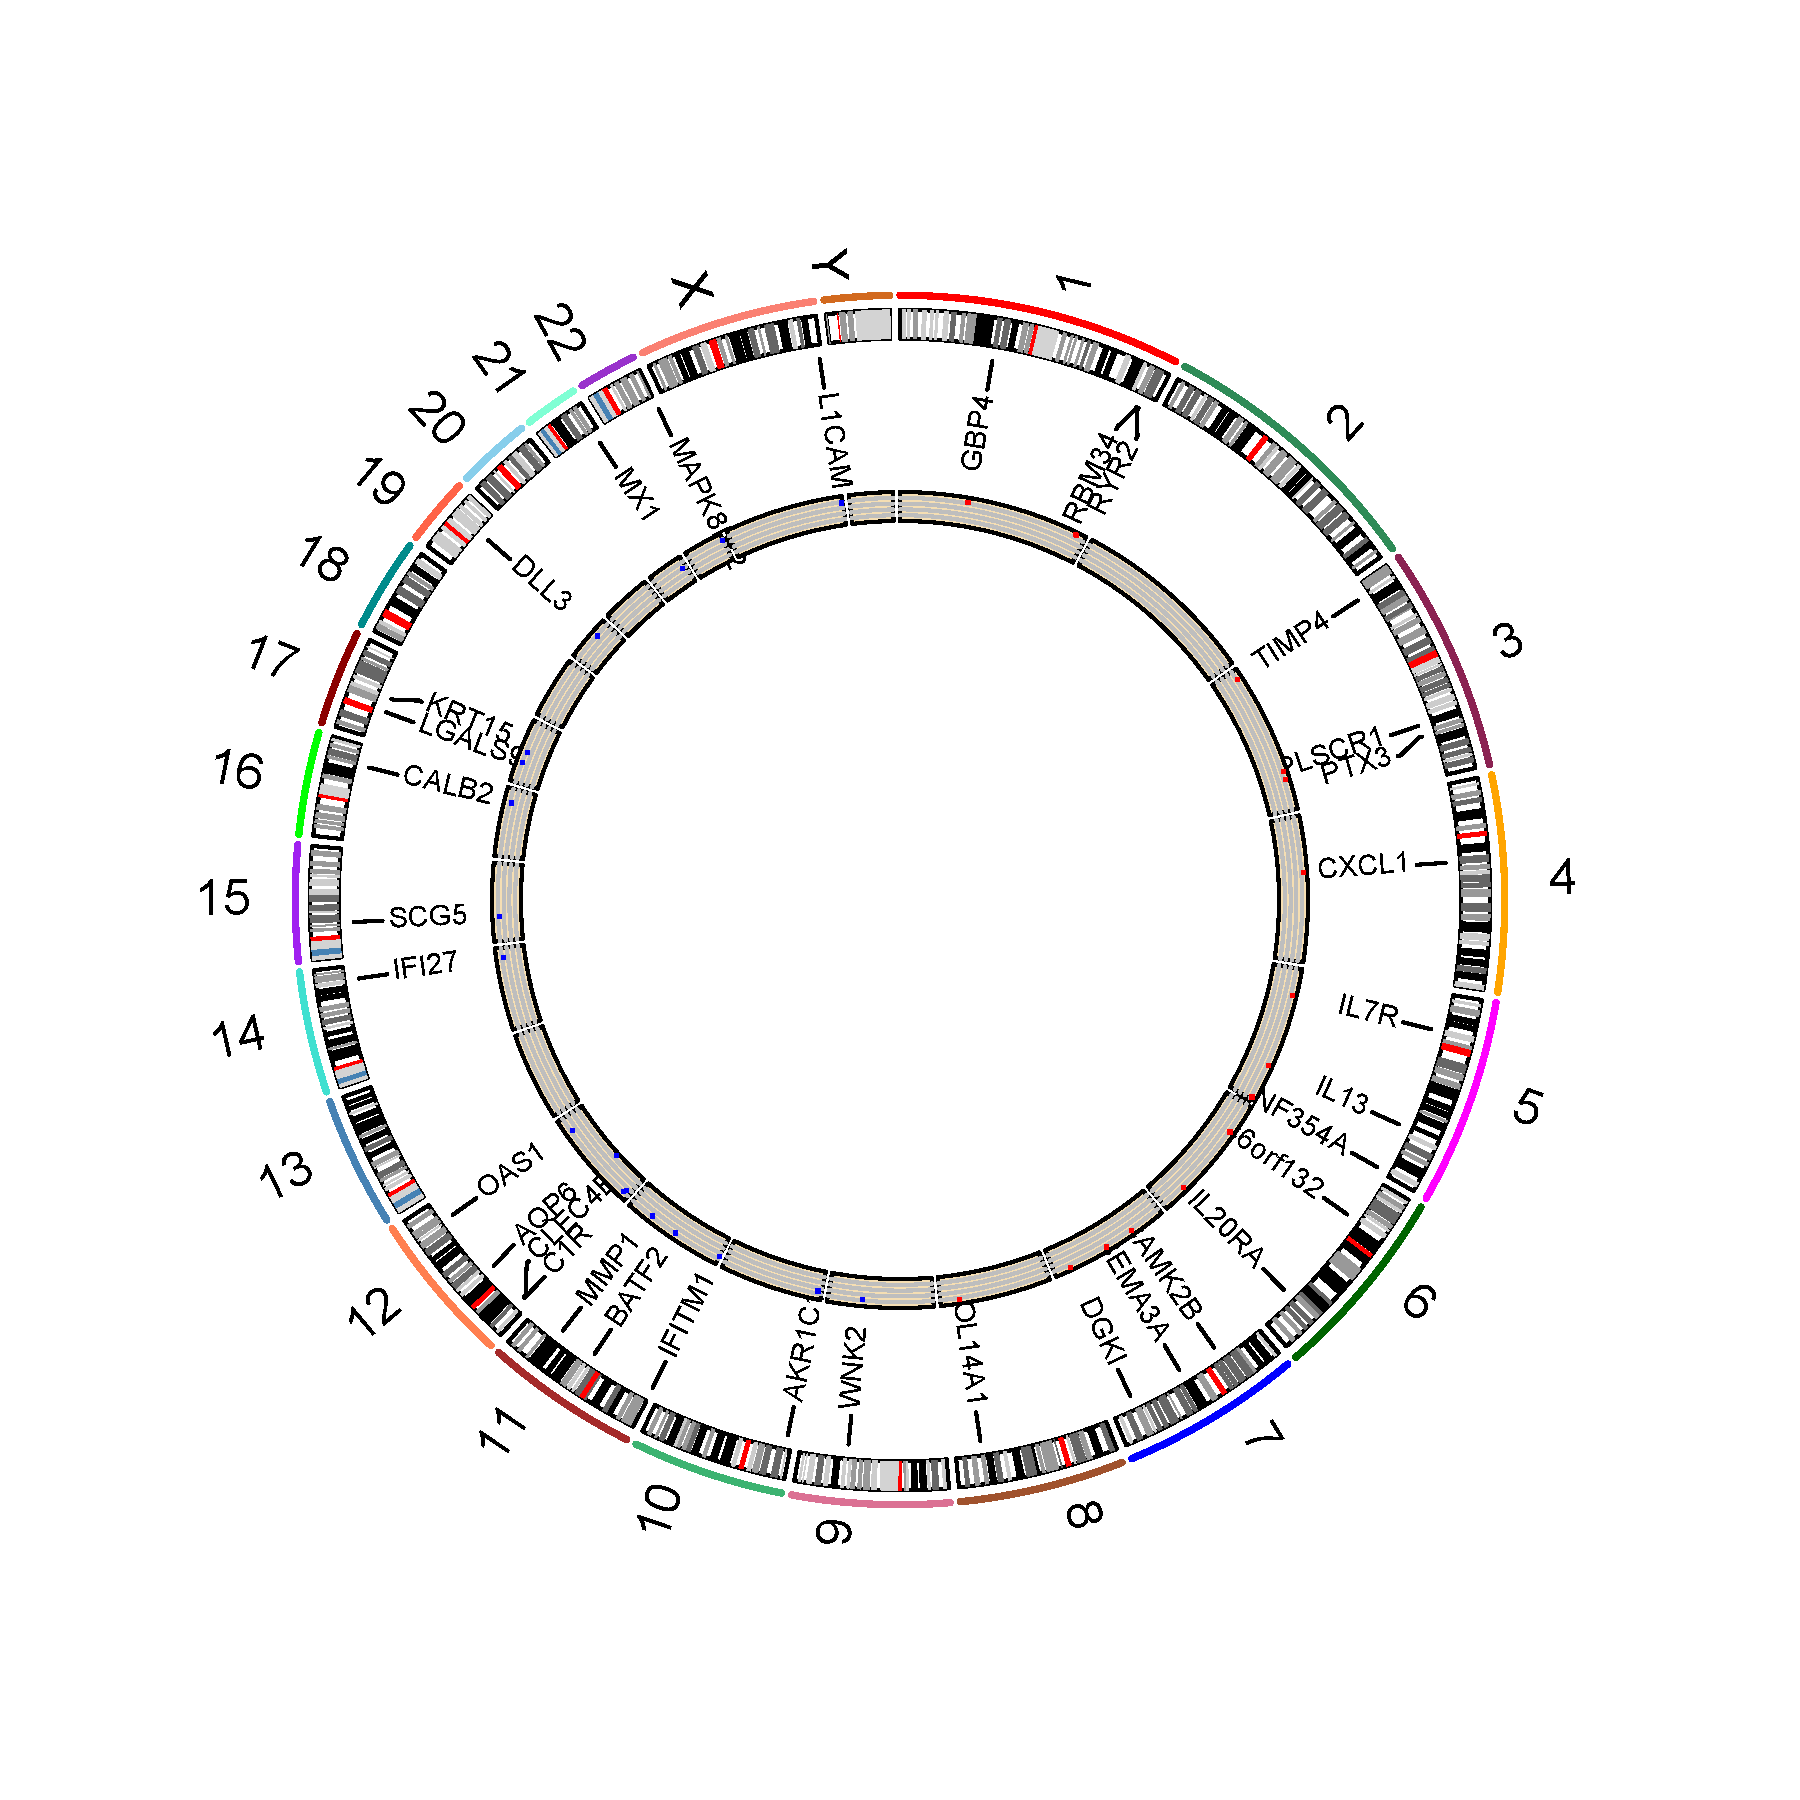
使用Rcircos包绘制差异表达基因,拷贝数变异(copy number variation,CNV)等。
数据说明
前三列为基因所在染色体及位置信息,第4列为基因名,第5列为log2FC或者其他任何有意义的数值,该列为可选列,若有则绘制scatter。
染色体名字请根据数据库里边的名字,例如chr1,chr2,......,chrX,chrY。注意大小写
论文例子
Development a m6A regulators characterized by the immune cell infiltration in stomach adenocarcinoma for predicting the prognosis and immunotherapy response
如何引用?
建议直接写网址。助力10000+篇
(google学术),9000+篇
(知网)论文
正式引用:Tang D, Chen M, Huang X, Zhang G, Zeng L, Zhang G, Wu S, Wang Y.
SRplot: A free online platform for data visualization and graphing. PLoS One. 2023 Nov 9;18(11):e0294236. doi: 10.1371/journal.pone.0294236. PMID: 37943830.
方法章节:Heatmap was plotted by https://www.bioinformatics.com.cn (last accessed on May 4, 2026), an online platform for data analysis and visualization.
致谢章节:We thank Mingjie Chen (Shanghai NewCore Biotechnology Co., Ltd.) for providing data analysis and visualization support.