Human mouse cibersort免疫浸润分析
简介
调用cibersort R函数利用去卷积方法进行免疫浸润分析。参考文献:Newman AM, et al. Robust enumeration of cell subsets from tissue expression profiles. Nat Methods. 2015 May;12(5):453-7
人的用的LM22数据集。小鼠的用的
Inference of immune cell composition on the expression profiles of mouse tissue附件数据集。
输入数据
输入包括两个:第一个是表达矩阵,第一列必须是gene symbol。1,不能有负值或者缺失值;2,不用log,程序默认自动判断;3,芯片推荐RMA(affymetrix)或者limma(agilent等)标准化;4,测序推荐用fpkm或者tpm。芯片默认quantile标准化,测序不标准化。
第二个输入是分组信息:第一列是样品名,第二列是组名。
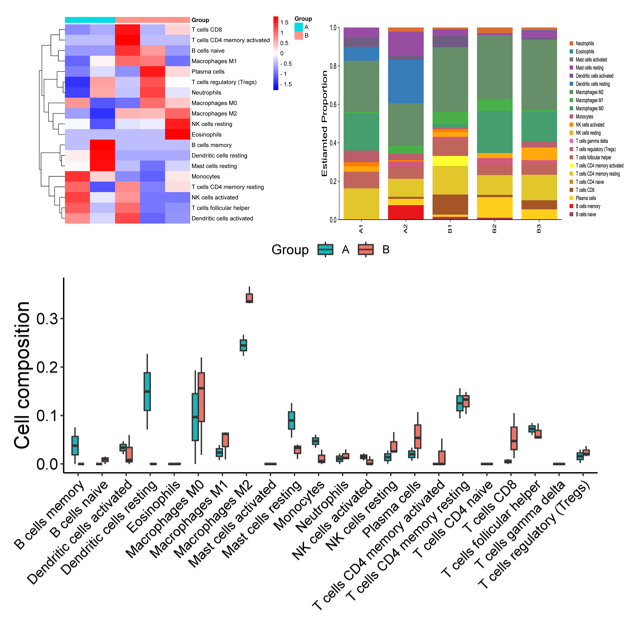
输出为:1,excel格式cibersort细胞类型占比;2,占比堆叠柱状图;3,热图;4,两组间的box图,用wilcoxon;多组间的用anova(最多10组)。* p<0.05,** p<0.01,*** p<0.001
论文例子
Identification of a novel gene signature for the prognosis of sepsis
论文写作
Immune cell infiltration analysis was usually used to study the pathogenesis of diseases. The CIBERSORT algorithm can calculate the
proportion of various immune cells in samples. We used this algorithm to analyze the immune cells of healthy subjects and patients with sepsis in GSE69528, and used the box plots to visualize the immune
cell composition of two groups of samples. We used Wilcoxon rank-sum test to assess the difference in the proportion of immune cells. The results of P < 0.05 were considered significant.
如何引用?
建议直接写网址。助力10000+篇
(google学术),9000+篇
(知网)论文
正式引用:Tang D, Chen M, Huang X, Zhang G, Zeng L, Zhang G, Wu S, Wang Y.
SRplot: A free online platform for data visualization and graphing. PLoS One. 2023 Nov 9;18(11):e0294236. doi: 10.1371/journal.pone.0294236. PMID: 37943830.
方法章节:Heatmap was plotted by https://www.bioinformatics.com.cn (last accessed on May 4, 2026), an online platform for data analysis and visualization.
致谢章节:We thank Mingjie Chen (Shanghai NewCore Biotechnology Co., Ltd.) for providing data analysis and visualization support.