点棒热图
简介
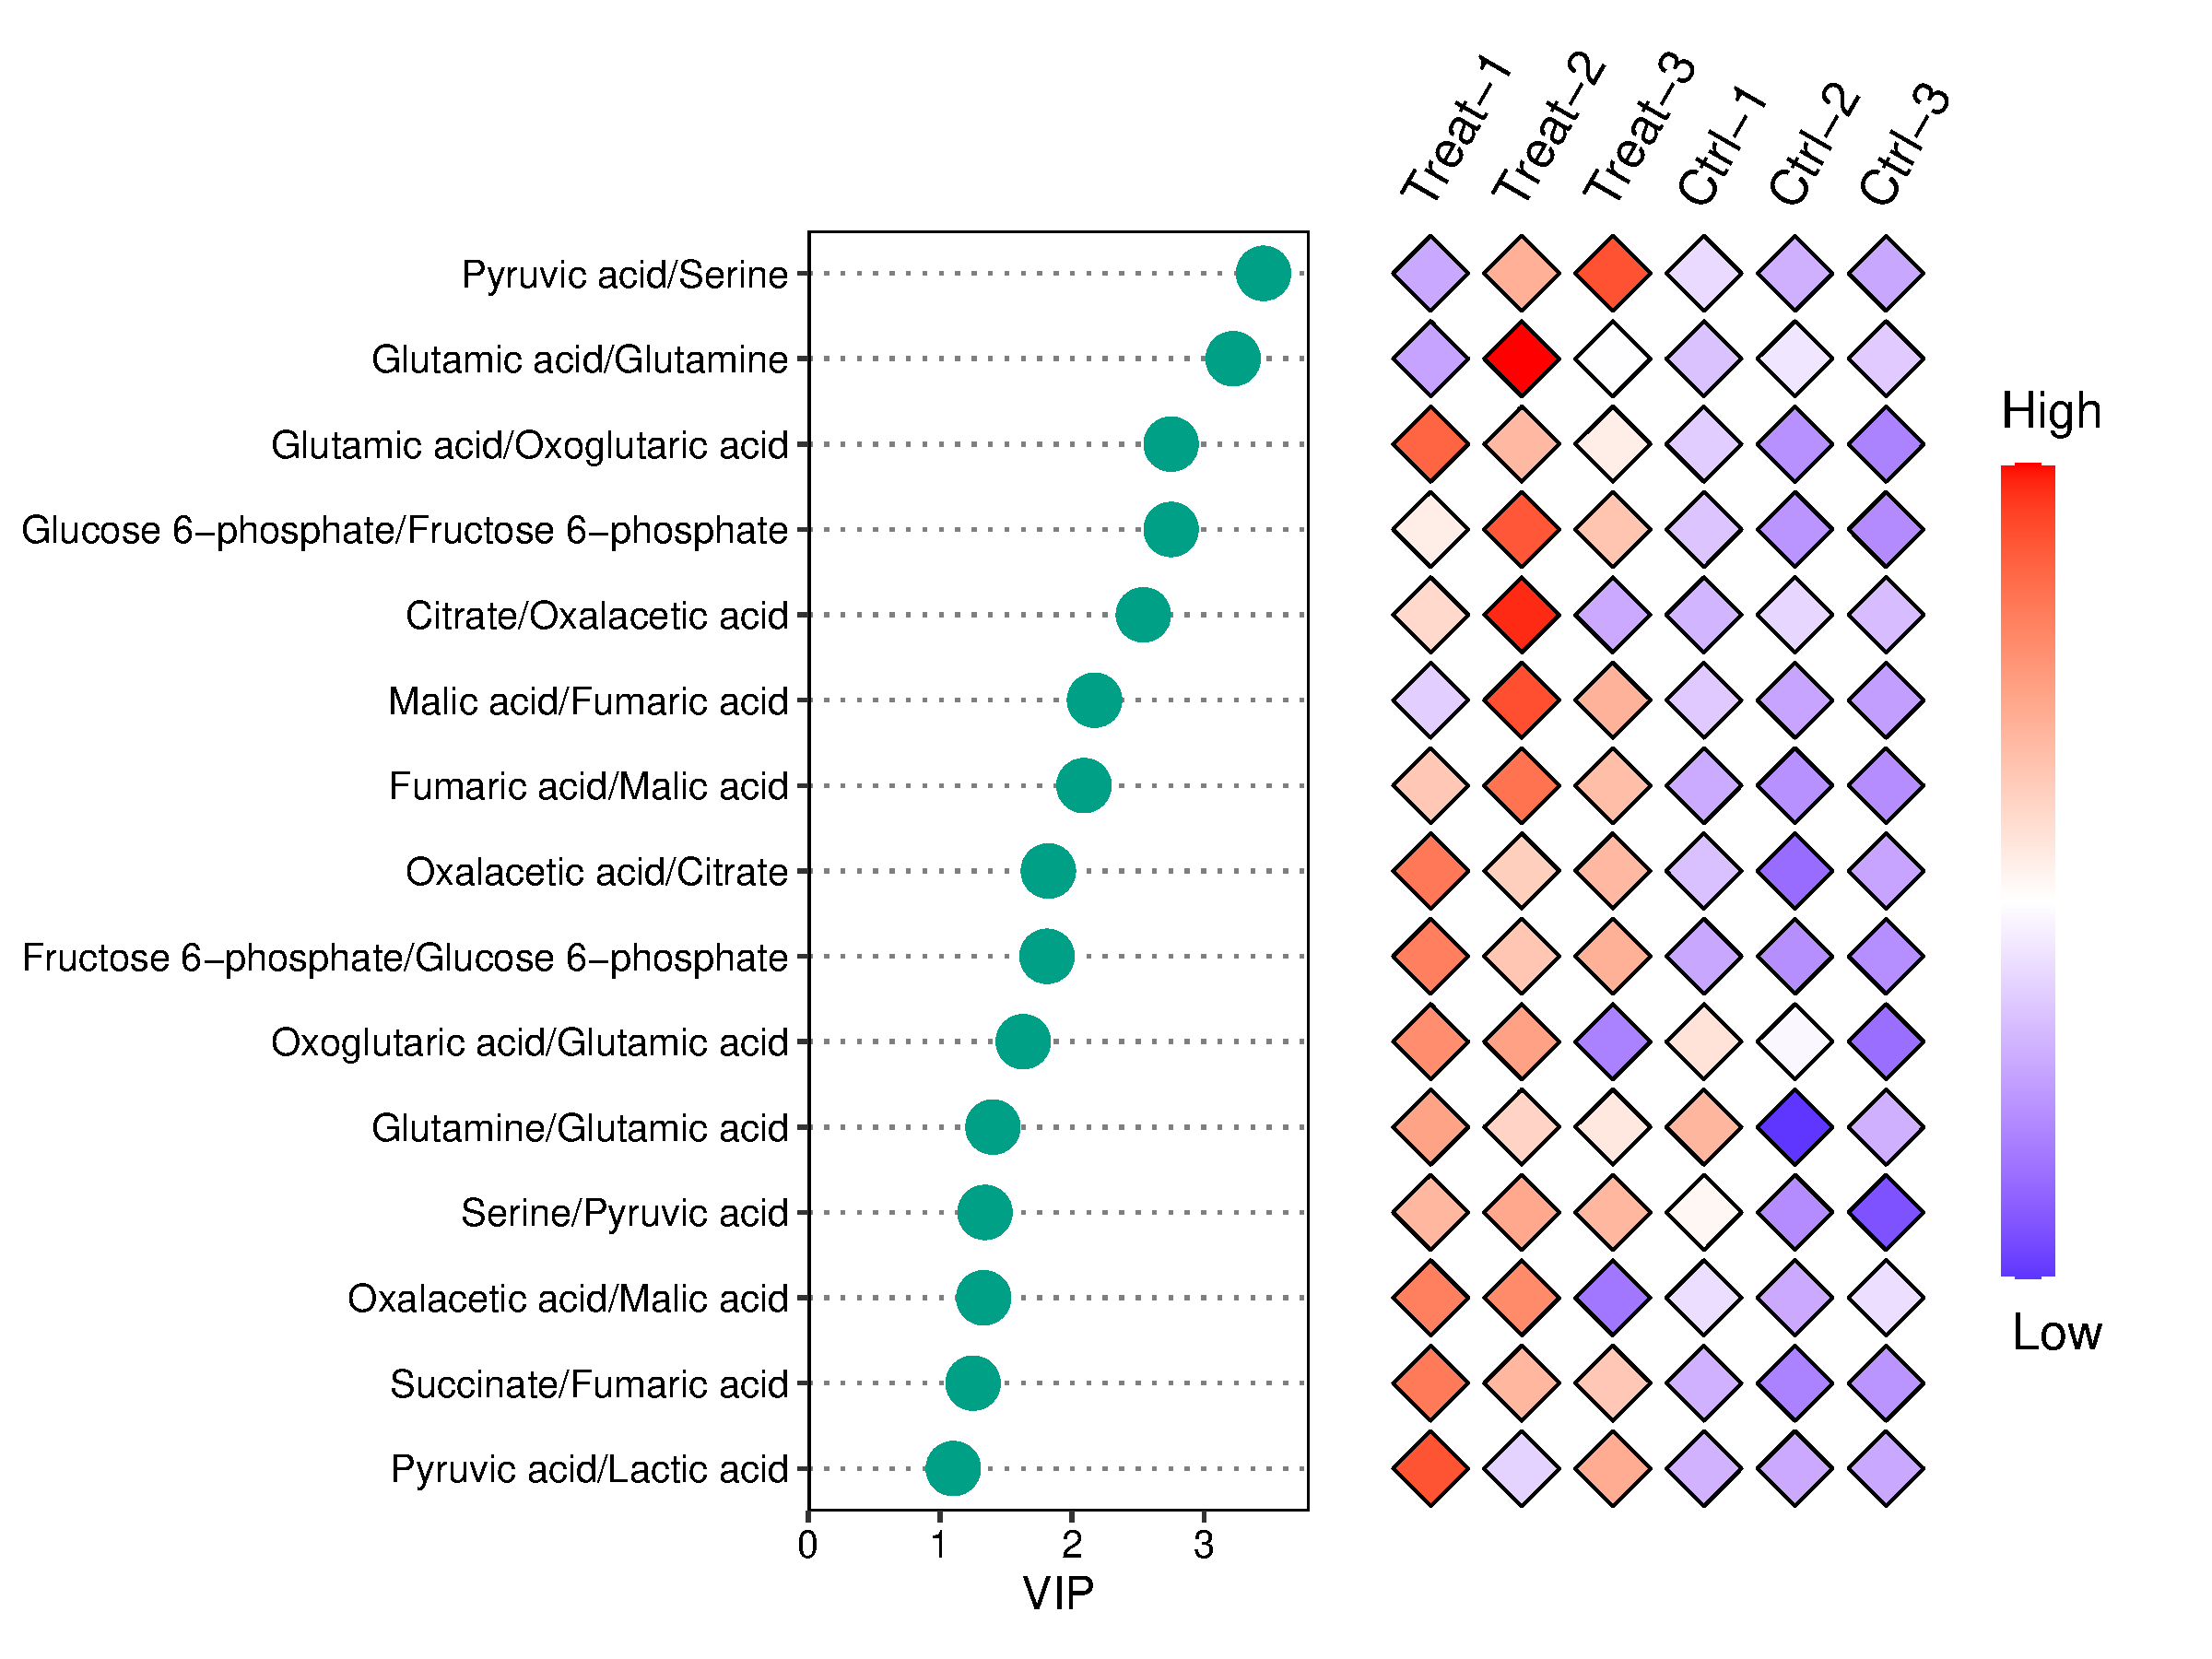
代谢组组学中常用的图。一般左侧为PLSDA的VIP值,右侧为信号热图。
数据说明
数据为矩阵形式,第一列是代谢物名字,最后一列是VIP值,其他列为信号值(默认zscore转换后绘图)。
论文例子
Comparative metabolites analysis of resistant, susceptible and wild rice species in response to bacterial blight disease. Fig4
写作参考
Integrated visualization of metabolite profiling. Left panel: Variable Importance in the Projection (VIP) scores from partial least‑squares discriminant analysis. The x-axis represents the VIP score, and the y-axis lists metabolites ranked by decreasing importance. Right panel: Heatmap showing relative abundance of significant metabolites (VIP ≥ 1) in control and infected samples. The x-axis indicates sample groups, the y-axis corresponds to the significant metabolites, and the color scale represents normalized signal intensity: red, high accumulation (up‑regulation); blue, low accumulation (down‑regulation); white/intermediate, near‑average levels.
如何引用?
建议直接写网址。助力10000+篇
(google学术),9000+篇
(知网)论文
正式引用:Tang D, Chen M, Huang X, Zhang G, Zeng L, Zhang G, Wu S, Wang Y.
SRplot: A free online platform for data visualization and graphing. PLoS One. 2023 Nov 9;18(11):e0294236. doi: 10.1371/journal.pone.0294236. PMID: 37943830.
方法章节:Heatmap was plotted by https://www.bioinformatics.com.cn (last accessed on May 4, 2026), an online platform for data analysis and visualization.
致谢章节:We thank Mingjie Chen (Shanghai NewCore Biotechnology Co., Ltd.) for providing data analysis and visualization support.