基因集富集分析(gene set enrichment analysis,GSEA)
简介
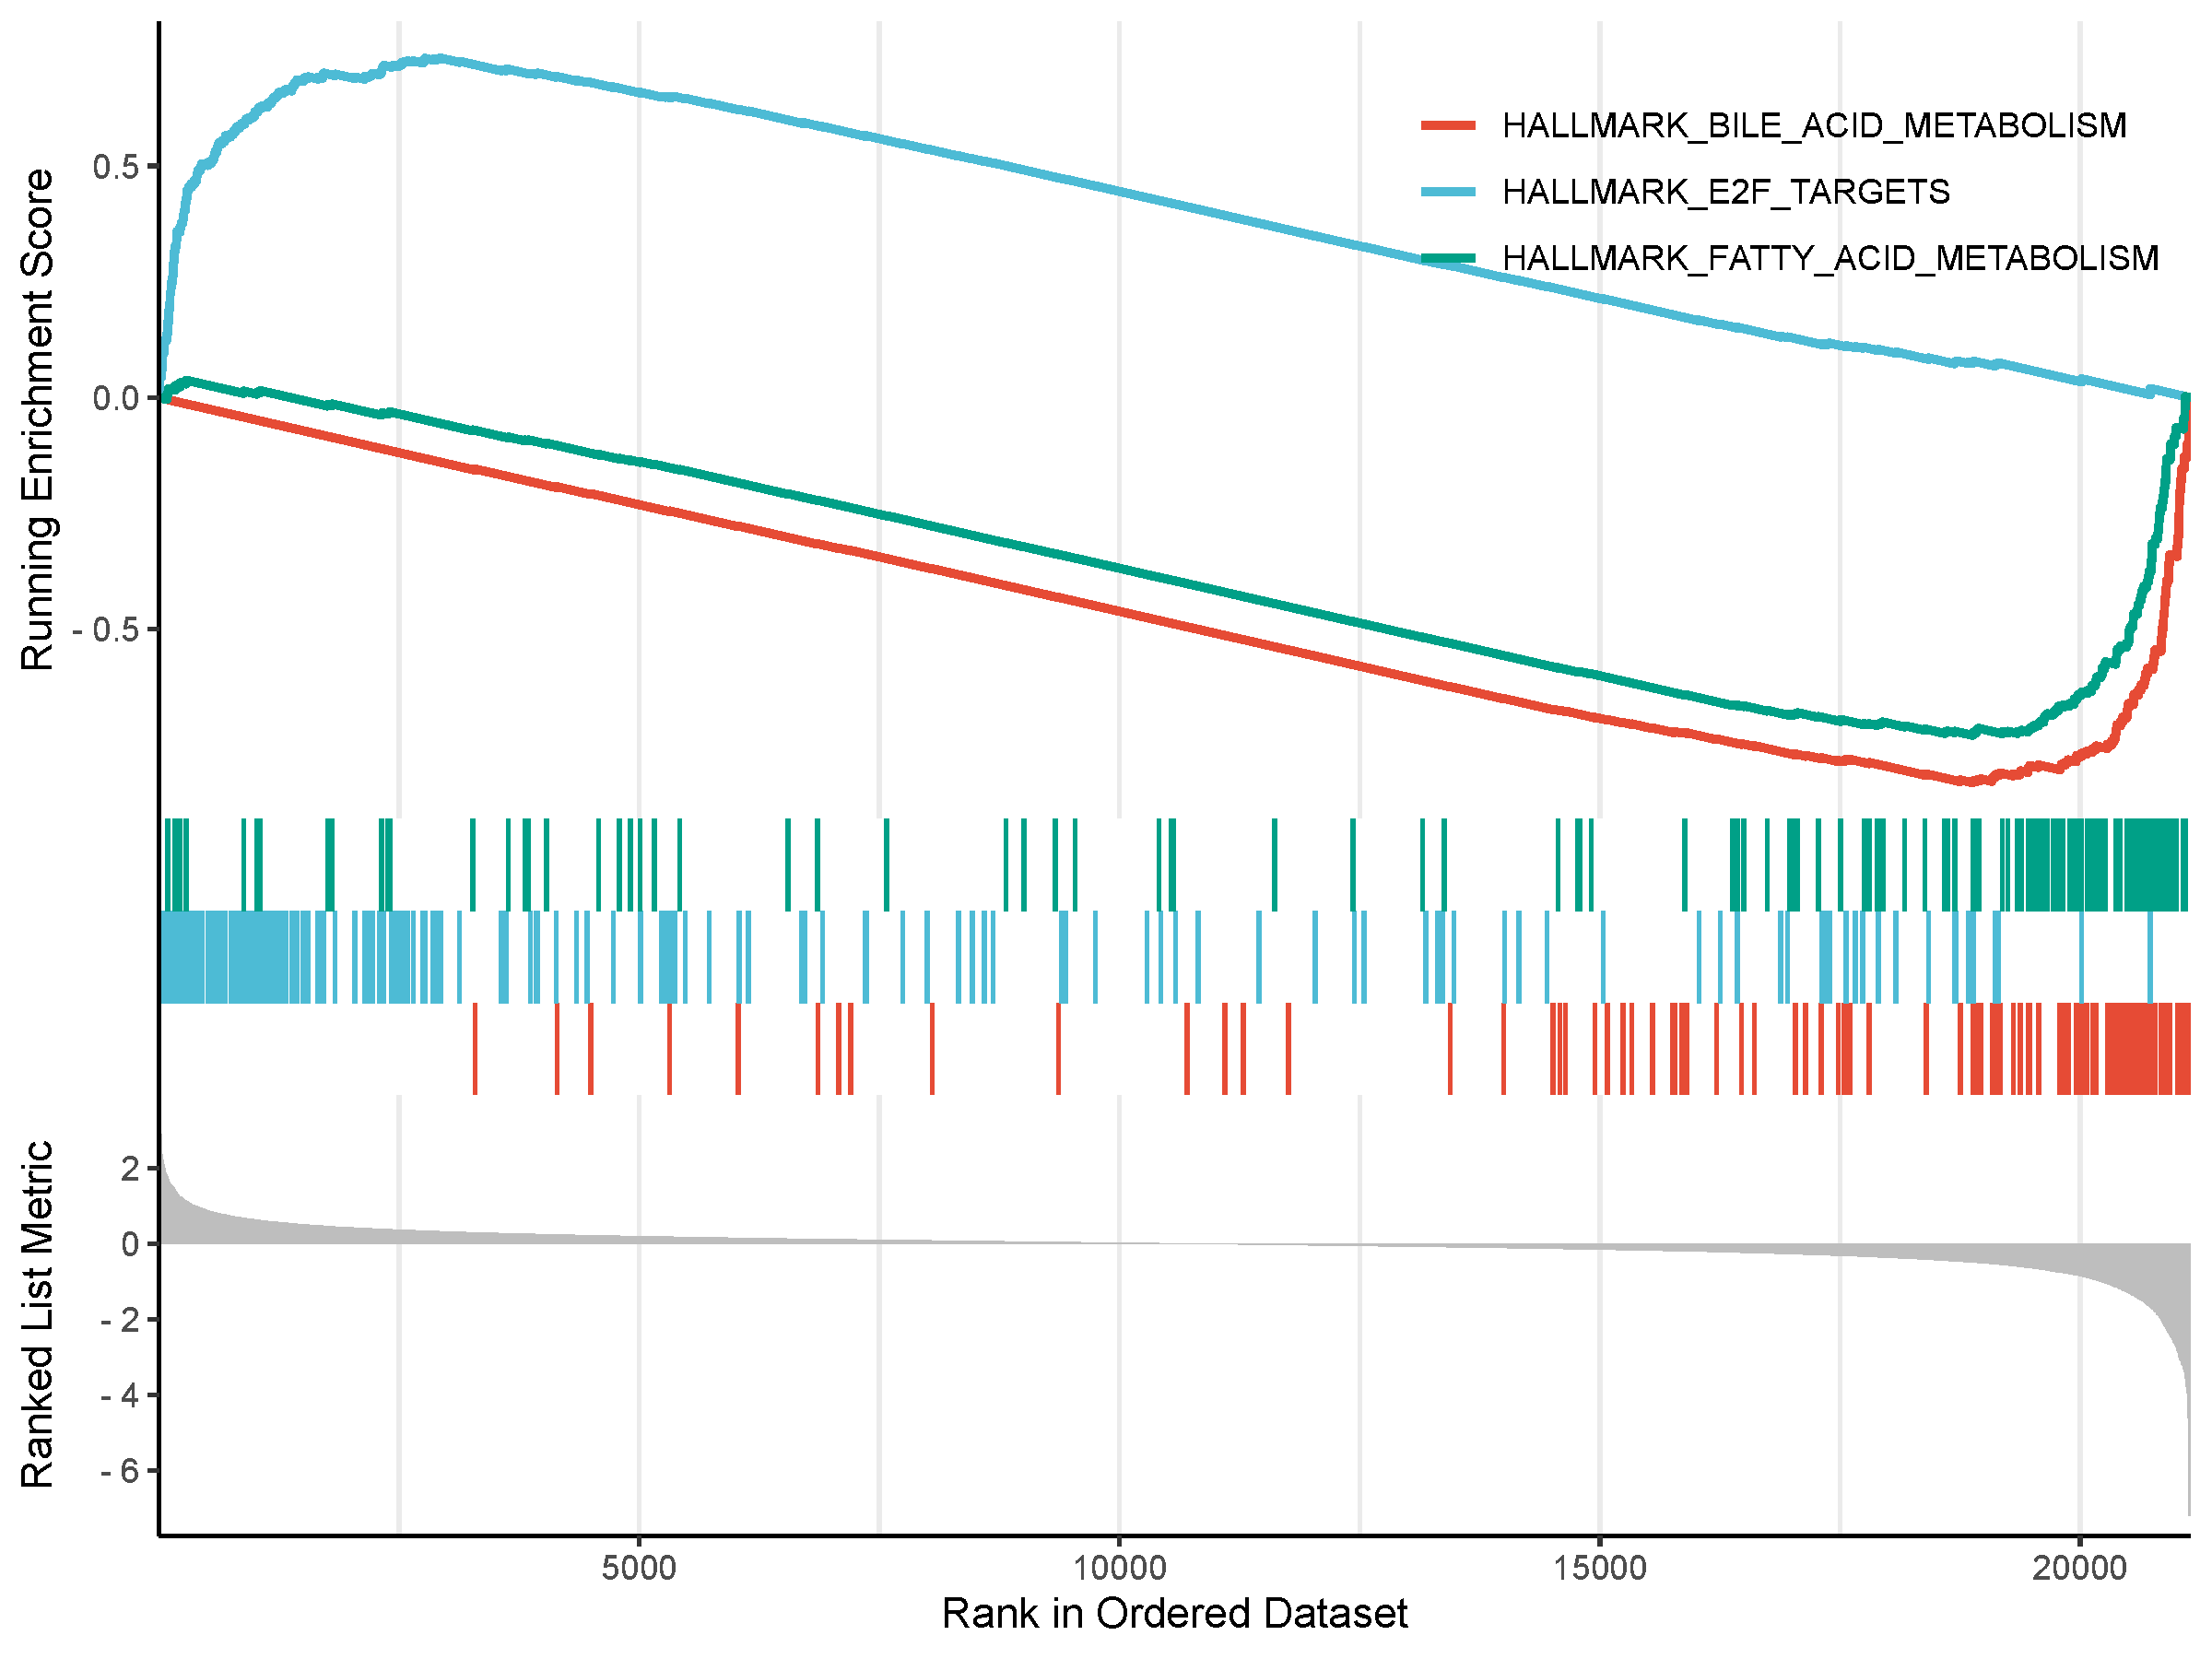
使用clusterprofiler R包进行基因集富集分析,输入为所有基因及log2FC,按照log2FC从大到小排列。内置了来自GSEA官网的基因集,以及自制的KEGG基因集。
数据说明
输入数据包括2列。第1列是基因symbol(例如人的是约20000个基因),大小写敏感;第2列是log2FC,从大到小排列(不排列的话,结果略有差异)。
自定义基因集框中有数据则自动切换自定义模式。例如铜死亡,铁死亡等(见示例),制表符分割。
第一列是基因集名字(不要使用特殊符号),第二列是基因集来源(网址或者其他说明文字),第三列及以后为基因(必需在所有输入的基因中)。
论文例子
High expression of cuproptosis-related SLC31A1 gene in relation to unfavorable outcome and deregulated immune cell infiltration in breast cancer: an analysis based on public databases. fig6e
常见问题
1,为什么有些pathway的p值是NA?
某些通路中存在不平衡的(positive和negative)基因水平统计值,P-values被设置为NA。
如何引用?
建议直接写网址。助力10000+篇
(google学术),9500+篇
(知网)论文
正式引用:Tang D, Chen M, Huang X, Zhang G, Zeng L, Zhang G, Wu S, Wang Y.
SRplot: A free online platform for data visualization and graphing. PLoS One. 2023 Nov 9;18(11):e0294236. doi: 10.1371/journal.pone.0294236. PMID: 37943830.
方法章节:Heatmap was plotted by https://www.bioinformatics.com.cn (last accessed on May 4, 2026), an online platform for data analysis and visualization.
致谢章节:We thank Mingjie Chen (Shanghai NewCore Biotechnology Co., Ltd.) for providing data analysis and visualization support.