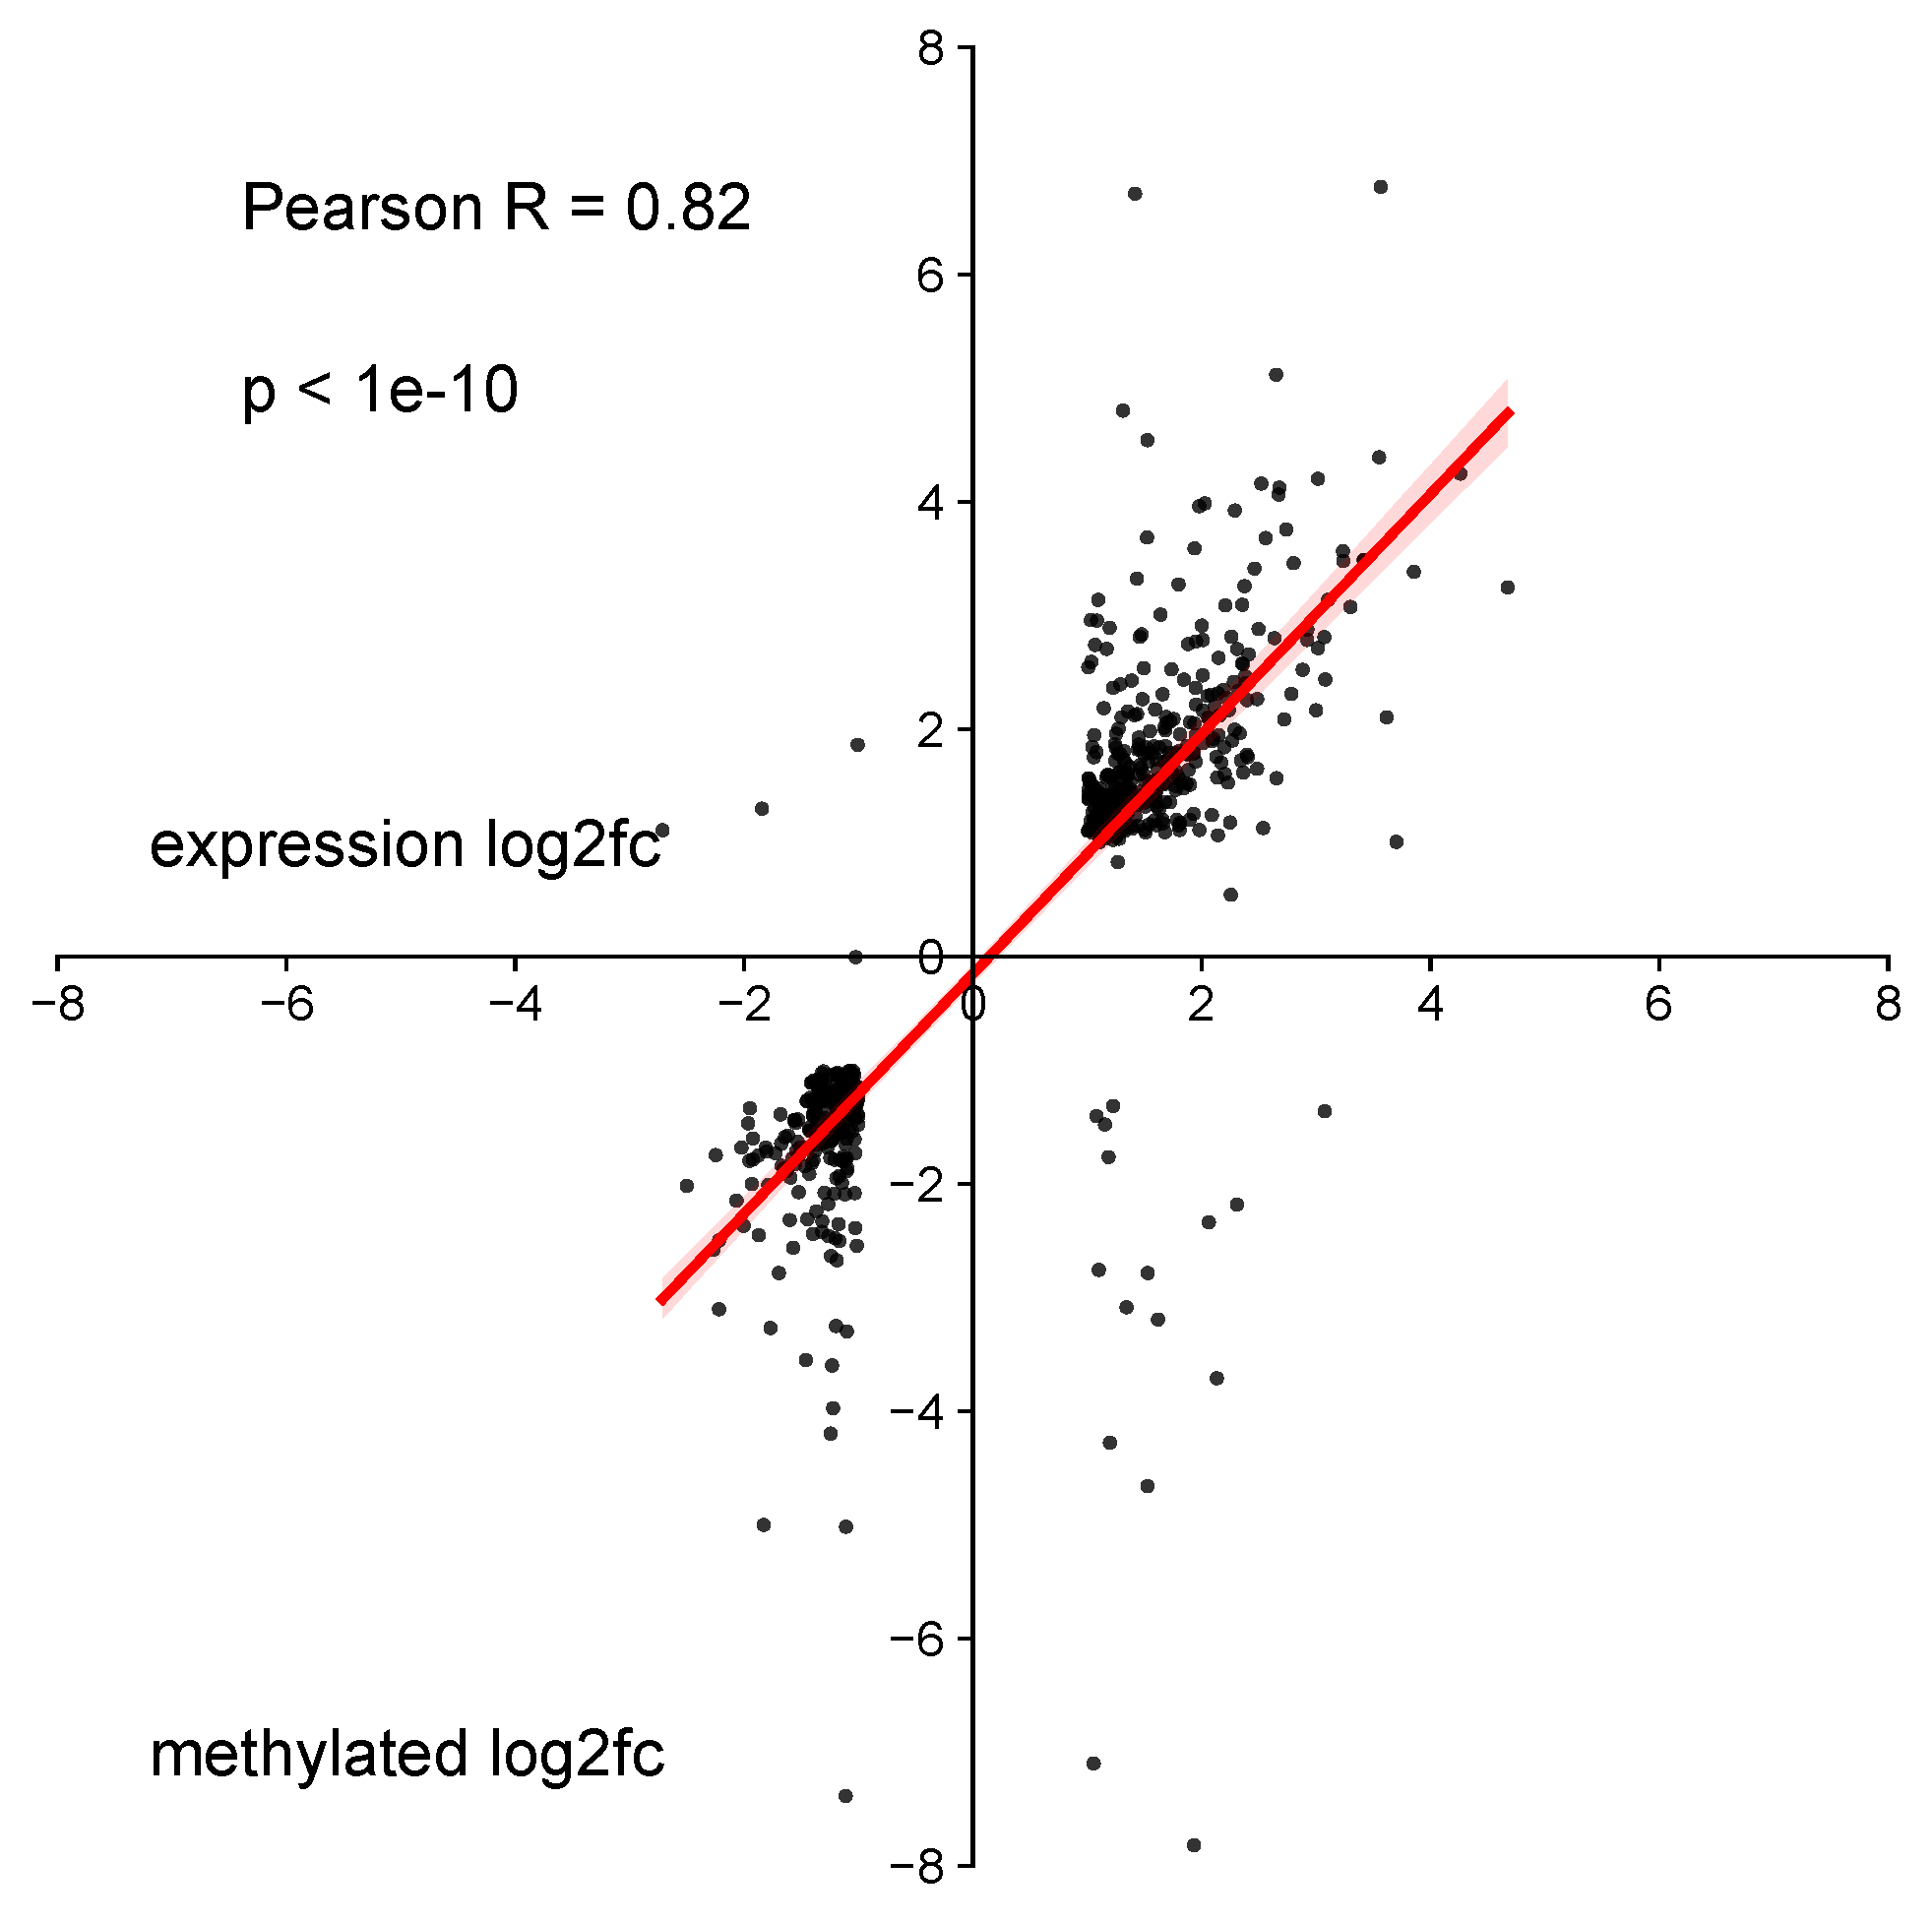
(m6A和表达谱)联合分析散点图
简介
使用相同基因的m6A log2倍数变化和表达谱倍数变化绘制散点图。
数据说明
数据包括3列,第一列是基因名,第二列为m6A(或其他相关数据)的log2fc,上调>=0,下调<0;第三列为表达谱(或其他相关数据)的log2fc,上调>=0,下调<0
论文例子
从两个维度展示相同基因的变化情况,常用于展示联合分析结果,例如甲基化修饰和表达。
m6A RNA modification modulates gene expression and cancer-related pathways in clear cell renal cell carcinoma Fig 4A.
如何引用?
建议直接写网址。助力10000+篇
(google学术),9000+篇
(知网)论文
正式引用:Tang D, Chen M, Huang X, Zhang G, Zeng L, Zhang G, Wu S, Wang Y.
SRplot: A free online platform for data visualization and graphing. PLoS One. 2023 Nov 9;18(11):e0294236. doi: 10.1371/journal.pone.0294236. PMID: 37943830.
方法章节:Heatmap was plotted by https://www.bioinformatics.com.cn (last accessed on May 4, 2026), an online platform for data analysis and visualization.
致谢章节:We thank Mingjie Chen (Shanghai NewCore Biotechnology Co., Ltd.) for providing data analysis and visualization support.