输入框上方有视频,先看视频再做图(测试账号:test,密码:bio123456)
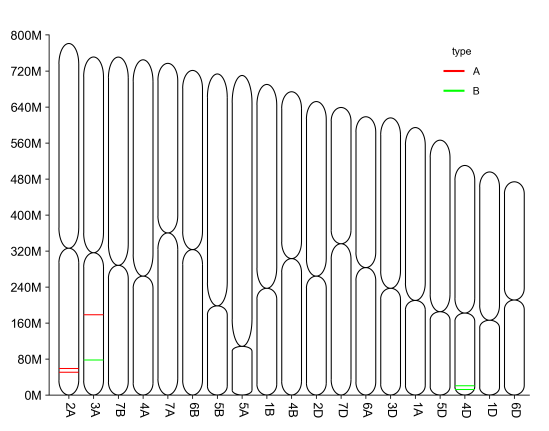
| 染色体长度输入 | 2A 780798557 326000000 3A 750843639 316000000 7B 750620385 288000000 4A 744588157 264000000 7A 736706236 360000000 6B 720988478 323000000 5B 713149757 198000000 5A 709773743 108000000 1B 689851870 237000000 4B 673617499 303000000 2D 651852609 264000000 7D 638686055 336000000 6A 618079260 283000000 3D 615552423 237000000 1A 594102056 210000000 5D 566080677 185000000 4D 509857067 182000000 1D 495453186 166000000 6D 473592718 211000000 |
| 基因组位点输入 | chrom pos type 2A 50602155 A 2A 58861277 A 3A 178099541 A 3A 77794217 B 4D 20732565 B 4D 11935999 B |
| 输出 |
|
1)如何作图?
1,准备作图数据;2,用excel打开数据,调整为示例格式;3,将调整后的数据粘贴到输入框;4,选择参数;5,提交出图
2)为什么不出图?
对输入数据格式有严格要求。请观看输入框上面的视频介绍,并仔细阅读右侧说明,示例数据。
3)如何引用?
3000+篇google学术,2400+篇知网学术引用
推荐直接写网址
Cite: Tang D, Chen M, Huang X, Zhang G, Zeng L, Zhang G, Wu S, Wang Y. SRplot: A free online platform for data visualization and graphing. PLoS One. 2023 Nov 9;18(11):e0294236. doi: 10.1371/journal.pone.0294236. PMID: 37943830.
Method: Heatmap was plotted by https://www.bioinformatics.com.cn (last accessed on 20 Feb 2024), an online platform for data analysis and visualization.
Acknowledgement: We thank Shanghai NewCore Biotechnology Co., Ltd. (https://www.bioinformatics.com.cn, last accessed on 20 Feb 2024) for providing data analysis and visualization support.
4)交流群/公众号
