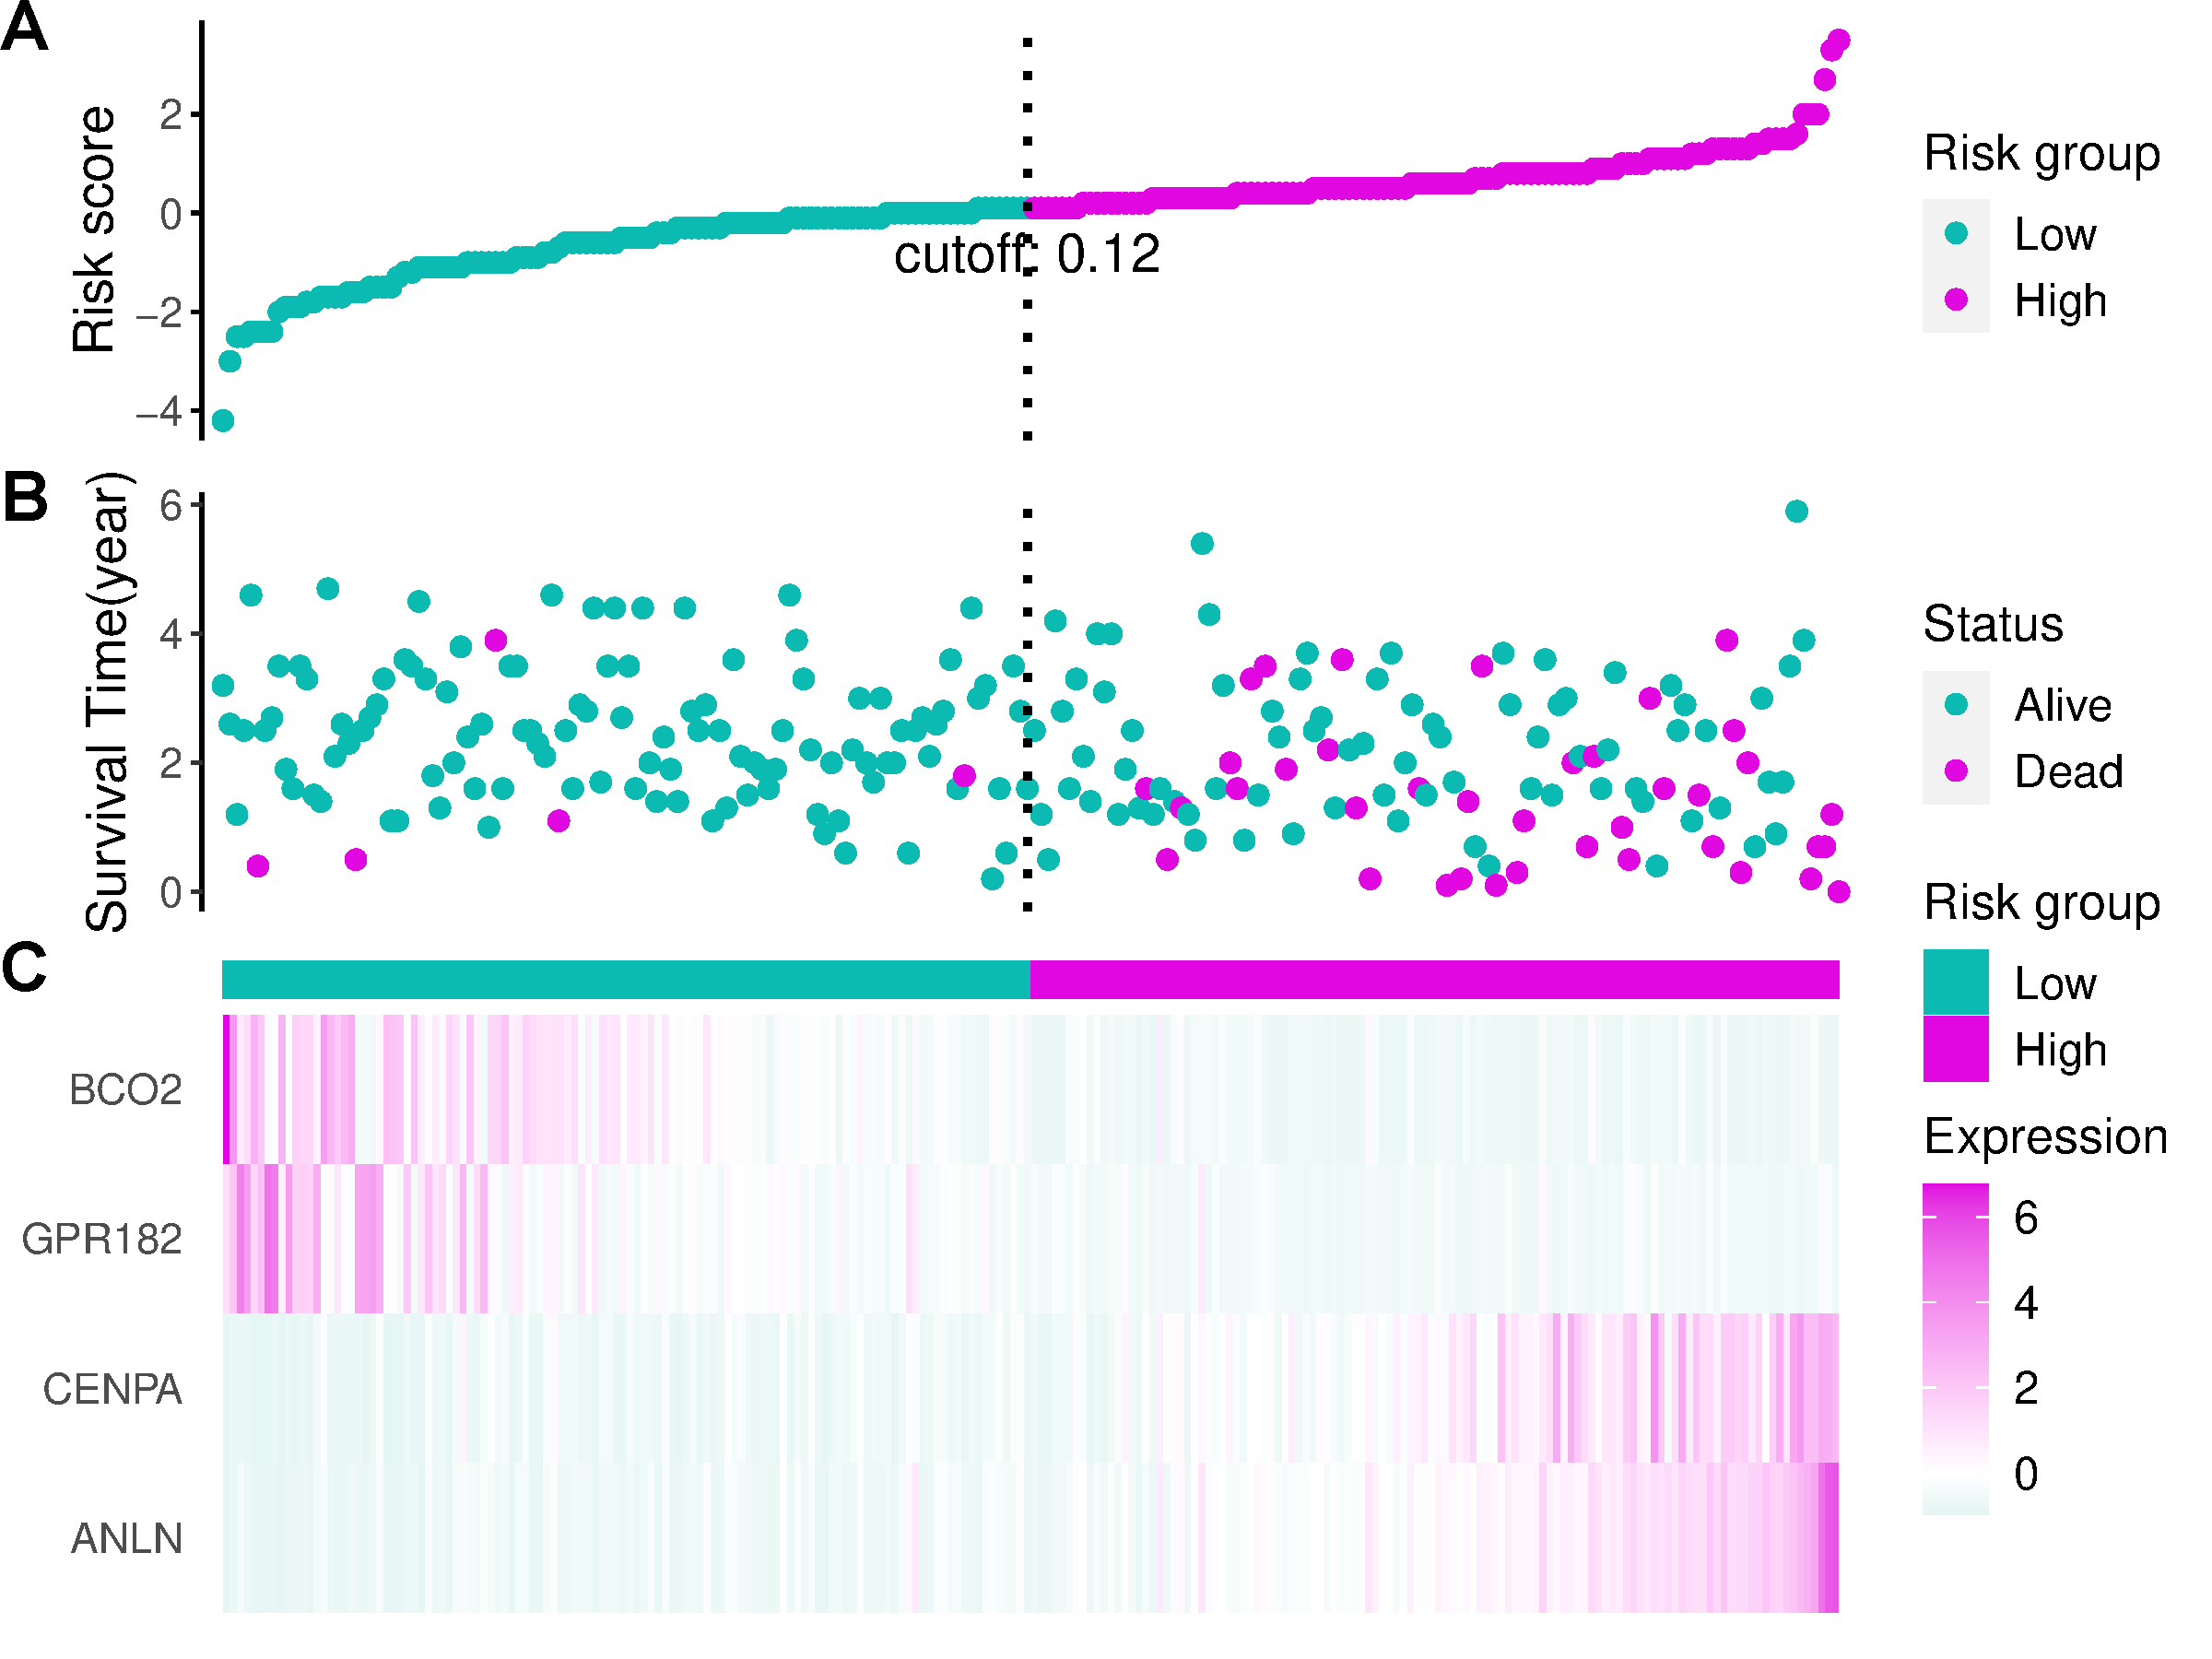
风险得分(risk score)三联图
简介
构建风险模型,获得风险得分,根据风险得分将患者分成高风险组和低风险组,研究基因表达对患者生存的关系。调用ggrisk 包
数据说明
输入数据至少包括:第1列为样品名;第2列为生存期(year,month,day);第3列为生存状态(0表示alive,1表示death);第4+列为基因的表达值。示例使用四个基因构建多因素cox回归模型,风险得分risk score是系统自动计算的,可以下载riskscore表,是按照排序后画的图
论文例子
Circadian Clock Genes Are Correlated with Prognosis and Immune Cell Infiltration in Colon Adenocarcinoma. Fig7
如何引用?
建议直接写网址。助力10000+篇
(google学术),9000+篇
(知网)论文
正式引用:Tang D, Chen M, Huang X, Zhang G, Zeng L, Zhang G, Wu S, Wang Y.
SRplot: A free online platform for data visualization and graphing. PLoS One. 2023 Nov 9;18(11):e0294236. doi: 10.1371/journal.pone.0294236. PMID: 37943830.
方法章节:Heatmap was plotted by https://www.bioinformatics.com.cn (last accessed on May 4, 2026), an online platform for data analysis and visualization.
致谢章节:We thank Mingjie Chen (Shanghai NewCore Biotechnology Co., Ltd.) for providing data analysis and visualization support.