两个数据集venn+bar组合图
简介
使用
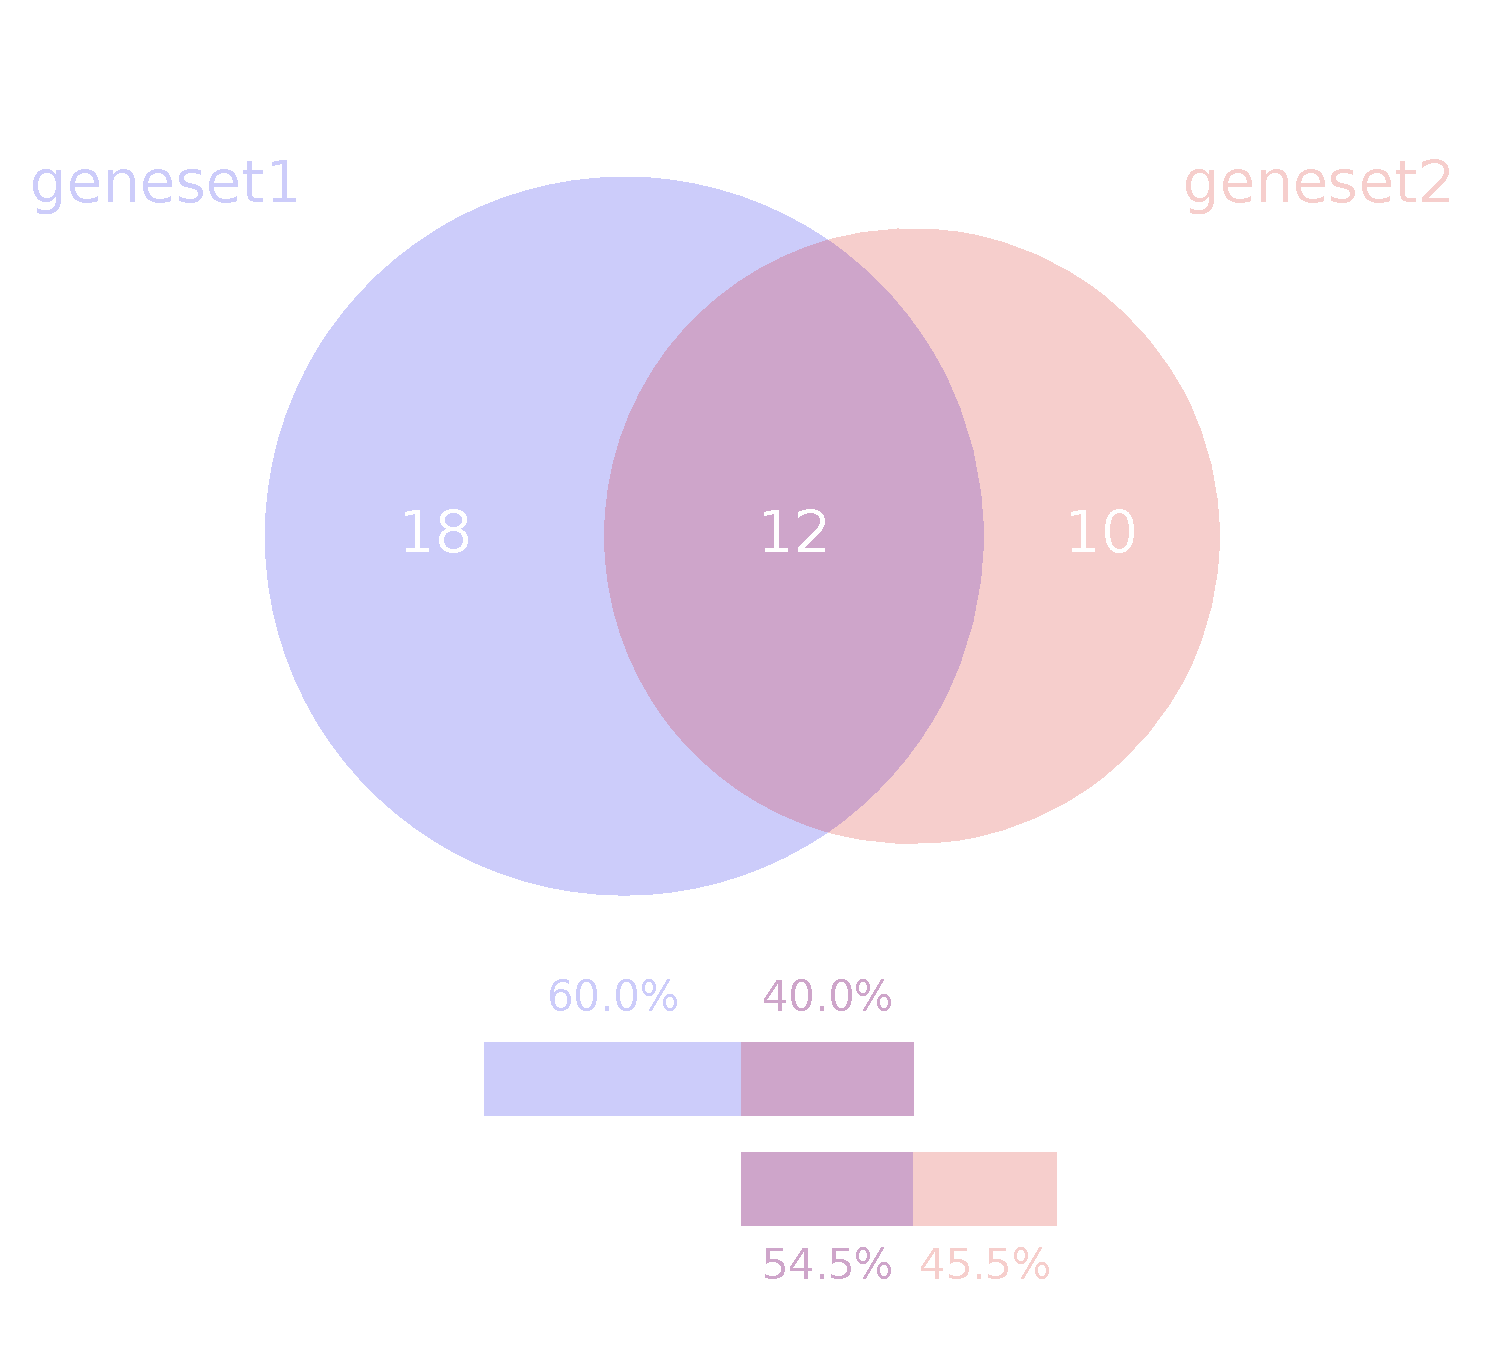
venn+bar组合图展示两个数据集的交集。venn图展示交集个数,条形图展示占比。
数据说明
两个数据集。每个数据集中一行一个。空行,重复行会自动去除
论文例子
RNA-mediated condensation of TFE3 oncofusions facilitates transcriptional hub formation to promote translocation renal cell carcinoma. fig1j
如何引用?
建议直接写网址。助力10000+篇
(google学术),9000+篇
(知网)论文
正式引用:Tang D, Chen M, Huang X, Zhang G, Zeng L, Zhang G, Wu S, Wang Y.
SRplot: A free online platform for data visualization and graphing. PLoS One. 2023 Nov 9;18(11):e0294236. doi: 10.1371/journal.pone.0294236. PMID: 37943830.
方法章节:Heatmap was plotted by https://www.bioinformatics.com.cn (last accessed on May 4, 2026), an online platform for data analysis and visualization.
致谢章节:We thank Mingjie Chen (Shanghai NewCore Biotechnology Co., Ltd.) for providing data analysis and visualization support.